Search for Indicators
All Data
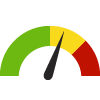
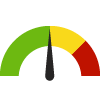
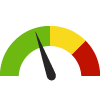
Indicator Gauge Icon Legend
Legend Colors
Red is bad, green is good, blue is not statistically different/neutral.
Compared to Distribution
 the value is in the best half of communities.
 the value is in the 2nd worst quarter of communities.
 the value is in the worst quarter of communities.
Compared to Target
 meets target;
  does not meet target.
Compared to a Single Value
 lower than the comparison value;
 higher than the comparison value;
 not statistically different from comparison value.
Trend

 non-significant change over time;
 significant change over time;
  no change over time.
Compared to Prior Value
 higher than the previous measurement period;
 lower than the previous measurement period;
 no statistically different change from previous measurement period.
County: Montgomery
Health / Alcohol & Drug Use
Value
Compared to:
County: Montgomery Adults who Binge Drink
County: Montgomery Adults who Binge Drink
12.9%
(2022)
Compared to:
MD Counties
The distribution is based on data from 24 Maryland counties.
U.S. Counties
The distribution is based on data from 3,133 U.S. counties and county equivalents.
US Value
(16.6%)
The regional value is compared to the national value.
County: Montgomery Adults who Drink Excessively
County: Montgomery Adults who Drink Excessively
12.9%
(2021)
Compared to:
MD Counties
The distribution is based on data from 24 Maryland counties.
U.S. Counties
The distribution is based on data from 3,141 U.S. counties and county equivalents.
MD Value
(15.2%)
The regional value is compared to the Maryland State value.
US Value
(18.1%)
The regional value is compared to the national value.
Prior Value
(14.5%)
Prior Value compares a measured value with the previously measured value. Confidence intervals were taken into account in determining the direction of the comparison.
Trend
This comparison measures the indicator’s values over multiple time periods.<br>The Mann-Kendall Test for Statistical Significance is used to evaluate the trend<br>over 4 to 10 periods of measure, subject to data availability and comparability.
County: Montgomery Age-Adjusted Death Rate due to Drug Use
County: Montgomery Age-Adjusted Death Rate due to Drug Use
14.2
Deaths per 100,000 population
(2019-2021)
Compared to:


MD Value
(42.2)
The regional value is compared to the Maryland State value.
US Value
(22.5 in 2017-2019)
The regional value is compared to the national value. The source for the national value is Centers for Disease Control and Prevention
Prior Value
(12.8)
Prior Value compares a measured value with the previously measured value. Confidence intervals were not taken into account in determining the direction of the comparison.
Trend
This comparison measures the indicator’s values over multiple time periods.<br>The Mann-Kendall Test for Statistical Significance is used to evaluate the trend<br>over 4 to 10 periods of measure, subject to data availability and comparability.
Maryland SHIP 2017
(12.6)
<div><span>The Maryland SHIP 2017 Target is to reduce the death rate due to drug use to 12.6 deaths per 100,000 population.</span></div>
County: Montgomery Households that Received Substance Abuse Medical Services
County: Montgomery Households that Received Substance Abuse Medical Services
1.1%
(2023)
Compared to:


MD Value
(1.2%)
The regional value is compared to the Maryland State value.
US Value
(1.3%)
The regional value is compared to the national value.
Prior Value
(1.2%)
Prior Value compares a measured value with the previously measured value. Confidence intervals were not taken into account in determining the direction of the comparison.
Trend
This comparison measures the indicator’s values over multiple time periods.<br>The Mann-Kendall Test for Statistical Significance is used to evaluate the trend<br>over 4 to 10 periods of measure, subject to data availability and comparability.
County: Montgomery
Health / Cancer
Value
Compared to:
County: Montgomery Adults with Cancer
County: Montgomery Adults with Cancer
6.7%
(2021)
Compared to:
MD Counties
The distribution is based on data from 24 Maryland counties.
U.S. Counties
The distribution is based on data from 3,074 U.S. counties and county equivalents.
US Value
(7.0%)
The regional value is compared to the national value.
County: Montgomery Adults with Cancer (Non-Skin) or Melanoma
County: Montgomery Adults with Cancer (Non-Skin) or Melanoma
7.5%
(2022)
Compared to:
MD Counties
The distribution is based on data from 24 Maryland counties.
U.S. Counties
The distribution is based on data from 3,133 U.S. counties and county equivalents.
US Value
(8.2%)
The regional value is compared to the national value.
County: Montgomery Age-Adjusted Death Rate due to Breast Cancer
County: Montgomery Age-Adjusted Death Rate due to Breast Cancer
17.2
Deaths per 100,000 females
(2018-2022)
Compared to:

MD Counties
The distribution is based on data from 23 Maryland counties.
U.S. Counties
The distribution is based on data from 1,778 U.S. counties and county equivalents.
MD Value
(20.0)
The regional value is compared to the Maryland State value.
US Value
(19.3)
The regional value is compared to the national value.
Prior Value
(18.1)
Prior Value compares a measured value with the previously measured value. Confidence intervals were taken into account in determining the direction of the comparison.
Trend
This comparison measures the indicator’s values over multiple time periods.<br>The Mann-Kendall Test for Statistical Significance is used to evaluate the trend<br>over 4 to 10 periods of measure, subject to data availability and comparability.
HP 2030 Target
(15.3)
County: Montgomery Age-Adjusted Death Rate due to Cancer
County: Montgomery Age-Adjusted Death Rate due to Cancer
106.9
Deaths per 100,000 population
(2018-2022)
Compared to:
MD Counties
The distribution is based on data from 24 Maryland counties.
U.S. Counties
The distribution is based on data from 3,080 U.S. counties and county equivalents.
MD Value
(141.7)
The regional value is compared to the Maryland State value.
US Value
(146.0)
The regional value is compared to the national value.
Prior Value
(111.8)
Prior Value compares a measured value with the previously measured value. Confidence intervals were taken into account in determining the direction of the comparison.
Trend
This comparison measures the indicator’s values over multiple time periods.<br>The Mann-Kendall Test for Statistical Significance is used to evaluate the trend<br>over 4 to 10 periods of measure, subject to data availability and comparability.
Maryland SHIP 2017
(147.4)
<div><span>The Maryland SHIP 2017 Target is to reduce the overall cancer death rate to 147.4 deaths per 100,000 population.</span></div>
Maryland SHIP 2014
(169.2)
<div><span>The Maryland SHIP 2014 Target is to reduce the overall cancer death rate to 169.2 deaths per 100,000 population.</span></div>
HP 2030 Target
(122.7)
County: Montgomery Age-Adjusted Death Rate due to Cervical Cancer
County: Montgomery Age-Adjusted Death Rate due to Cervical Cancer
1.3
Deaths per 100,000 females
(2018-2022)
Compared to:

MD Value
(2.0)
The regional value is compared to the Maryland State value.
US Value
(2.2)
The regional value is compared to the national value.
Prior Value
(1.3)
Prior Value compares a measured value with the previously measured value. Confidence intervals were taken into account in determining the direction of the comparison.
Trend
This comparison measures the indicator’s values over multiple time periods.<br>The Mann-Kendall Test for Statistical Significance is used to evaluate the trend<br>over 4 to 10 periods of measure, subject to data availability and comparability.
County: Montgomery Age-Adjusted Death Rate due to Colorectal Cancer
County: Montgomery Age-Adjusted Death Rate due to Colorectal Cancer
10.5
Deaths per 100,000 population
(2018-2022)
Compared to:
MD Counties
The distribution is based on data from 24 Maryland counties.
U.S. Counties
The distribution is based on data from 2,180 U.S. counties and county equivalents.
MD Value
(12.7)
The regional value is compared to the Maryland State value.
US Value
(12.9)
The regional value is compared to the national value.
Prior Value
(10.1)
Prior Value compares a measured value with the previously measured value. Confidence intervals were taken into account in determining the direction of the comparison.
Trend
This comparison measures the indicator’s values over multiple time periods.<br>The Mann-Kendall Test for Statistical Significance is used to evaluate the trend<br>over 4 to 10 periods of measure, subject to data availability and comparability.
HP 2030 Target
(8.9)
County: Montgomery Age-Adjusted Death Rate due to Lung Cancer
County: Montgomery Age-Adjusted Death Rate due to Lung Cancer
17.1
Deaths per 100,000 population
(2018-2022)
Compared to:
MD Counties
The distribution is based on data from 24 Maryland counties.
U.S. Counties
The distribution is based on data from 2,746 U.S. counties and county equivalents.
MD Value
(29.9)
The regional value is compared to the Maryland State value.
US Value
(32.4)
The regional value is compared to the national value.
Prior Value
(18.7)
Prior Value compares a measured value with the previously measured value. Confidence intervals were taken into account in determining the direction of the comparison.
Trend
This comparison measures the indicator’s values over multiple time periods.<br>The Mann-Kendall Test for Statistical Significance is used to evaluate the trend<br>over 4 to 10 periods of measure, subject to data availability and comparability.
HP 2030 Target
(25.1)
County: Montgomery Age-Adjusted Death Rate due to Prostate Cancer
County: Montgomery Age-Adjusted Death Rate due to Prostate Cancer
13.8
Deaths per 100,000 males
(2018-2022)
Compared to:
U.S. Counties
The distribution is based on data from 1,612 U.S. counties and county equivalents.
MD Value
(19.9)
The regional value is compared to the Maryland State value.
US Value
(19.0)
The regional value is compared to the national value.
Prior Value
(14.1)
Prior Value compares a measured value with the previously measured value. Confidence intervals were taken into account in determining the direction of the comparison.
Trend
This comparison measures the indicator’s values over multiple time periods.<br>The Mann-Kendall Test for Statistical Significance is used to evaluate the trend<br>over 4 to 10 periods of measure, subject to data availability and comparability.
HP 2030 Target
(16.9)
County: Montgomery All Cancer Incidence Rate
County: Montgomery All Cancer Incidence Rate
394.2
Cases per 100,000 population
(2017-2021)
Compared to:
MD Counties
The distribution is based on data from 24 Maryland counties.
U.S. Counties
The distribution is based on data from 2,931 U.S. counties and county equivalents.
MD Value
(446.8)
The regional value is compared to the Maryland State value.
US Value
(444.4)
The regional value is compared to the national value.
Prior Value
(385.0)
Prior Value compares a measured value with the previously measured value. Confidence intervals were taken into account in determining the direction of the comparison.
Trend
This comparison measures the indicator’s values over multiple time periods.<br>The Mann-Kendall Test for Statistical Significance is used to evaluate the trend<br>over 4 to 10 periods of measure, subject to data availability and comparability.
County: Montgomery Breast Cancer Incidence Rate
County: Montgomery Breast Cancer Incidence Rate
136.3
Cases per 100,000 females
(2017-2021)
Compared to:

MD Counties
The distribution is based on data from 24 Maryland counties.
U.S. Counties
The distribution is based on data from 2,712 U.S. counties and county equivalents.
MD Value
(135.5)
The regional value is compared to the Maryland State value.
US Value
(129.8)
The regional value is compared to the national value.
Prior Value
(127.4)
Prior Value compares a measured value with the previously measured value. Confidence intervals were taken into account in determining the direction of the comparison.
Trend
This comparison measures the indicator’s values over multiple time periods.<br>The Mann-Kendall Test for Statistical Significance is used to evaluate the trend<br>over 4 to 10 periods of measure, subject to data availability and comparability.
County: Montgomery Cancer: Medicare Population
County: Montgomery Cancer: Medicare Population
12.0%
(2022)
Compared to:
MD Counties
The distribution is based on data from 24 Maryland counties.
U.S. Counties
The distribution is based on data from 3,129 U.S. counties and county equivalents.
MD Value
(12.0%)
The regional value is compared to the Maryland State value.
US Value
(12.0%)
The regional value is compared to the national value.
Prior Value
(12.0%)
Prior Value compares a measured value with the previously measured value. Confidence intervals were not taken into account in determining the direction of the comparison.
Trend
This comparison measures the indicator’s values over multiple time periods.<br>The Mann-Kendall Test for Statistical Significance is used to evaluate the trend<br>over 4 to 10 periods of measure, subject to data availability and comparability.
County: Montgomery Cervical Cancer Incidence Rate
County: Montgomery Cervical Cancer Incidence Rate
4.7
Cases per 100,000 females
(2017-2021)
Compared to:
U.S. Counties
The distribution is based on data from 727 U.S. counties and county equivalents.
MD Value
(6.4)
The regional value is compared to the Maryland State value.
US Value
(7.5)
The regional value is compared to the national value.
Prior Value
(4.9)
Prior Value compares a measured value with the previously measured value. Confidence intervals were taken into account in determining the direction of the comparison.
Trend
This comparison measures the indicator’s values over multiple time periods.<br>The Mann-Kendall Test for Statistical Significance is used to evaluate the trend<br>over 4 to 10 periods of measure, subject to data availability and comparability.
County: Montgomery Cervical Cancer Screening: 21-65
County: Montgomery Cervical Cancer Screening: 21-65
84.3%
(2020)
Compared to:
MD Counties
The distribution is based on data from 24 Maryland counties.
U.S. Counties
The distribution is based on data from 3,141 U.S. counties and county equivalents.
US Value
(82.8%)
The regional value is compared to the national value.
County: Montgomery Colon Cancer Screening: USPSTF Recommendation
County: Montgomery Colon Cancer Screening: USPSTF Recommendation
69.7%
(2022)
Compared to:
MD Counties
The distribution is based on data from 24 Maryland counties.
U.S. Counties
The distribution is based on data from 3,133 U.S. counties and county equivalents.
US Value
(66.3%)
The regional value is compared to the national value.
County: Montgomery Colorectal Cancer Incidence Rate
County: Montgomery Colorectal Cancer Incidence Rate
30.1
Cases per 100,000 population
(2017-2021)
Compared to:
MD Counties
The distribution is based on data from 24 Maryland counties.
U.S. Counties
The distribution is based on data from 2,613 U.S. counties and county equivalents.
MD Value
(35.2)
The regional value is compared to the Maryland State value.
US Value
(36.4)
The regional value is compared to the national value.
Prior Value
(29.3)
Prior Value compares a measured value with the previously measured value. Confidence intervals were taken into account in determining the direction of the comparison.
Trend
This comparison measures the indicator’s values over multiple time periods.<br>The Mann-Kendall Test for Statistical Significance is used to evaluate the trend<br>over 4 to 10 periods of measure, subject to data availability and comparability.
County: Montgomery Households that Received Cancer Medical Services
County: Montgomery Households that Received Cancer Medical Services
8.4%
(2023)
Compared to:


MD Value
(8.3%)
The regional value is compared to the Maryland State value.
US Value
(8.3%)
The regional value is compared to the national value.
Prior Value
(8.9%)
Prior Value compares a measured value with the previously measured value. Confidence intervals were not taken into account in determining the direction of the comparison.
Trend
This comparison measures the indicator’s values over multiple time periods.<br>The Mann-Kendall Test for Statistical Significance is used to evaluate the trend<br>over 4 to 10 periods of measure, subject to data availability and comparability.
County: Montgomery Lung and Bronchus Cancer Incidence Rate
County: Montgomery Lung and Bronchus Cancer Incidence Rate
29.4
Cases per 100,000 population
(2017-2021)
Compared to:
MD Counties
The distribution is based on data from 24 Maryland counties.
U.S. Counties
The distribution is based on data from 2,711 U.S. counties and county equivalents.
MD Value
(50.0)
The regional value is compared to the Maryland State value.
US Value
(53.1)
The regional value is compared to the national value.
Prior Value
(29.2)
Prior Value compares a measured value with the previously measured value. Confidence intervals were taken into account in determining the direction of the comparison.
Trend
This comparison measures the indicator’s values over multiple time periods.<br>The Mann-Kendall Test for Statistical Significance is used to evaluate the trend<br>over 4 to 10 periods of measure, subject to data availability and comparability.
County: Montgomery Mammogram in Past 2 Years: 50+
County: Montgomery Mammogram in Past 2 Years: 50+
16.2%
(2020)
Compared to:


MD Counties
(2018)
The distribution is based on data from 23 Maryland counties and county equivalents.
MD Value
(18.2%)
The regional value is compared to the Maryland State value.
Prior Value
(83.7%)
Prior Value compares a measured value with the previously measured value. Confidence intervals were taken into account in determining the direction of the comparison.
Trend
This comparison measures the indicator’s values over multiple time periods.<br>The Mann-Kendall Test for Statistical Significance is used to evaluate the trend<br>over 4 to 10 periods of measure, subject to data availability and comparability.
County: Montgomery Mammography Screening: Medicare Population
County: Montgomery Mammography Screening: Medicare Population
46.0%
(2022)
Compared to:
MD Counties
The distribution is based on data from 24 Maryland counties.
U.S. Counties
The distribution is based on data from 3,123 U.S. counties and county equivalents.
MD Value
(47.0%)
The regional value is compared to the Maryland State value.
US Value
(47.0%)
The regional value is compared to the national value.
Prior Value
(44.0%)
Prior Value compares a measured value with the previously measured value. Confidence intervals were not taken into account in determining the direction of the comparison.
Trend
This comparison measures the indicator’s values over multiple time periods.<br>The Mann-Kendall Test for Statistical Significance is used to evaluate the trend<br>over 4 to 10 periods of measure, subject to data availability and comparability.
County: Montgomery Oral Cavity and Pharynx Cancer Incidence Rate
County: Montgomery Oral Cavity and Pharynx Cancer Incidence Rate
8.6
Cases per 100,000 population
(2017-2021)
Compared to:
MD Counties
The distribution is based on data from 24 Maryland counties.
U.S. Counties
The distribution is based on data from 1,869 U.S. counties and county equivalents.
MD Value
(11.1)
The regional value is compared to the Maryland State value.
US Value
(12.0)
The regional value is compared to the national value.
Prior Value
(8.7)
Prior Value compares a measured value with the previously measured value. Confidence intervals were taken into account in determining the direction of the comparison.
Trend
This comparison measures the indicator’s values over multiple time periods.<br>The Mann-Kendall Test for Statistical Significance is used to evaluate the trend<br>over 4 to 10 periods of measure, subject to data availability and comparability.
County: Montgomery Prostate Cancer Incidence Rate
County: Montgomery Prostate Cancer Incidence Rate
127.8
Cases per 100,000 males
(2017-2021)
Compared to:

MD Counties
The distribution is based on data from 24 Maryland counties.
U.S. Counties
The distribution is based on data from 2,728 U.S. counties and county equivalents.
MD Value
(136.4)
The regional value is compared to the Maryland State value.
US Value
(113.2)
The regional value is compared to the national value.
Prior Value
(123.6)
Prior Value compares a measured value with the previously measured value. Confidence intervals were taken into account in determining the direction of the comparison.
Trend
This comparison measures the indicator’s values over multiple time periods.<br>The Mann-Kendall Test for Statistical Significance is used to evaluate the trend<br>over 4 to 10 periods of measure, subject to data availability and comparability.
County: Montgomery
Health / Diabetes
Value
Compared to:
County: Montgomery Adults Who Bought Medications for Diabetes
County: Montgomery Adults Who Bought Medications for Diabetes
8.7%
(2023)
Compared to:
MD Value
(9.8%)
The regional value is compared to the Maryland State value.
US Value
(10.7%)
The regional value is compared to the national value.
Prior Value
(8.7%)
Prior Value compares a measured value with the previously measured value. Confidence intervals were not taken into account in determining the direction of the comparison.
Trend
This comparison measures the indicator’s values over multiple time periods.<br>The Mann-Kendall Test for Statistical Significance is used to evaluate the trend<br>over 4 to 10 periods of measure, subject to data availability and comparability.
County: Montgomery Adults with Diabetes
County: Montgomery Adults with Diabetes
7.1%
(2021)
Compared to:
MD Counties
The distribution is based on data from 23 Maryland counties and county equivalents.
MD Value
(9.8%)
The regional value is compared to the Maryland State value.
US Value
(10.9%)
The regional value is compared to the national value. The source for the national value is Behavioral Risk Factor Surveillance System
Prior Value
(6.4%)
Prior Value compares a measured value with the previously measured value. Confidence intervals were taken into account in determining the direction of the comparison.
Trend
This comparison measures the indicator’s values over multiple time periods.<br>The Mann-Kendall Test for Statistical Significance is used to evaluate the trend<br>over 4 to 10 periods of measure, subject to data availability and comparability.
County: Montgomery Age-Adjusted Death Rate due to Diabetes
County: Montgomery Age-Adjusted Death Rate due to Diabetes
13.7
Deaths per 100,000 population
(2019-2021)
Compared to:
MD Value
(22.7)
The regional value is compared to the Maryland State value.
US Value
(24.8 in 2020)
The regional value is compared to the national value. The source for the national value is Centers for Disease Control and Prevention
Prior Value
(12.2)
Prior Value compares a measured value with the previously measured value. Confidence intervals were not taken into account in determining the direction of the comparison.
Trend
This comparison measures the indicator’s values over multiple time periods.<br>The Mann-Kendall Test for Statistical Significance is used to evaluate the trend<br>over 4 to 10 periods of measure, subject to data availability and comparability.
County: Montgomery Diabetes: Medicare Population
County: Montgomery Diabetes: Medicare Population
22.0%
(2022)
Compared to:
MD Counties
The distribution is based on data from 24 Maryland counties.
U.S. Counties
The distribution is based on data from 3,129 U.S. counties and county equivalents.
MD Value
(27.0%)
The regional value is compared to the Maryland State value.
US Value
(24.0%)
The regional value is compared to the national value.
Prior Value
(22.0%)
Prior Value compares a measured value with the previously measured value. Confidence intervals were not taken into account in determining the direction of the comparison.
Trend
This comparison measures the indicator’s values over multiple time periods.<br>The Mann-Kendall Test for Statistical Significance is used to evaluate the trend<br>over 4 to 10 periods of measure, subject to data availability and comparability.
County: Montgomery
Health / Disabilities
Value
Compared to:
County: Montgomery Adults with Disability Living in Poverty
County: Montgomery Adults with Disability Living in Poverty
17.0%
(2018-2022)
Compared to:
MD Counties
The distribution is based on data from 24 Maryland counties.
U.S. Counties
The distribution is based on data from 3,132 U.S. counties and county equivalents.
MD Value
(21.2%)
The regional value is compared to the Maryland State value.
US Value
(24.9%)
The regional value is compared to the national value.
Trend
This comparison measures the indicator’s values over multiple time periods.<br>The Mann-Kendall Test for Statistical Significance is used to evaluate the trend<br>over 4 to 10 periods of measure, subject to data availability and comparability.
County: Montgomery Children with a Disability
County: Montgomery Children with a Disability
3.4%
(2018-2022)
Compared to:

MD Value
(4.3%)
The regional value is compared to the Maryland State value.
US Value
(4.5%)
The regional value is compared to the national value.
Trend
This comparison measures the indicator’s values over multiple time periods.<br>The Mann-Kendall Test for Statistical Significance is used to evaluate the trend<br>over 4 to 10 periods of measure, subject to data availability and comparability.
County: Montgomery Persons with a Cognitive Difficulty
County: Montgomery Persons with a Cognitive Difficulty
3.6%
(2018-2022)
Compared to:
MD Value
(4.7%)
The regional value is compared to the Maryland State value.
US Value
(5.3%)
The regional value is compared to the national value.
Trend
This comparison measures the indicator’s values over multiple time periods.<br>The Mann-Kendall Test for Statistical Significance is used to evaluate the trend<br>over 4 to 10 periods of measure, subject to data availability and comparability.
County: Montgomery Persons with a Disability
County: Montgomery Persons with a Disability
8.8%
(2018-2022)
Compared to:
MD Value
(11.3%)
The regional value is compared to the Maryland State value.
US Value
(12.9%)
The regional value is compared to the national value.
Trend
This comparison measures the indicator’s values over multiple time periods.<br>The Mann-Kendall Test for Statistical Significance is used to evaluate the trend<br>over 4 to 10 periods of measure, subject to data availability and comparability.
County: Montgomery Persons with a Hearing Difficulty
County: Montgomery Persons with a Hearing Difficulty
2.5%
(2018-2022)
Compared to:
MD Value
(2.8%)
The regional value is compared to the Maryland State value.
US Value
(3.6%)
The regional value is compared to the national value.
Trend
This comparison measures the indicator’s values over multiple time periods.<br>The Mann-Kendall Test for Statistical Significance is used to evaluate the trend<br>over 4 to 10 periods of measure, subject to data availability and comparability.
County: Montgomery Persons with a Self-Care Difficulty
County: Montgomery Persons with a Self-Care Difficulty
1.9%
(2018-2022)
Compared to:
MD Value
(2.2%)
The regional value is compared to the Maryland State value.
US Value
(2.6%)
The regional value is compared to the national value.
Trend
This comparison measures the indicator’s values over multiple time periods.<br>The Mann-Kendall Test for Statistical Significance is used to evaluate the trend<br>over 4 to 10 periods of measure, subject to data availability and comparability.
County: Montgomery Persons with a Vision Difficulty
County: Montgomery Persons with a Vision Difficulty
1.5%
(2018-2022)
Compared to:
MD Value
(1.9%)
The regional value is compared to the Maryland State value.
US Value
(2.4%)
The regional value is compared to the national value.
Trend
This comparison measures the indicator’s values over multiple time periods.<br>The Mann-Kendall Test for Statistical Significance is used to evaluate the trend<br>over 4 to 10 periods of measure, subject to data availability and comparability.
County: Montgomery Persons with an Ambulatory Difficulty
County: Montgomery Persons with an Ambulatory Difficulty
4.1%
(2018-2022)
Compared to:
MD Value
(5.8%)
The regional value is compared to the Maryland State value.
US Value
(6.7%)
The regional value is compared to the national value.
Trend
This comparison measures the indicator’s values over multiple time periods.<br>The Mann-Kendall Test for Statistical Significance is used to evaluate the trend<br>over 4 to 10 periods of measure, subject to data availability and comparability.
County: Montgomery Veterans with a Disability
County: Montgomery Veterans with a Disability
22.3%
(2018-2022)
Compared to:
MD Value
(23.5%)
The regional value is compared to the Maryland State value.
US Value
(29.8%)
The regional value is compared to the national value.
Trend
This comparison measures the indicator’s values over multiple time periods.<br>The Mann-Kendall Test for Statistical Significance is used to evaluate the trend<br>over 4 to 10 periods of measure, subject to data availability and comparability.
County: Montgomery
Health / Family Planning
Value
Compared to:
County: Montgomery Teen Birth Rate: 15-19
County: Montgomery Teen Birth Rate: 15-19
7.1
Live births per 1,000 females aged 15-19
(2021)
Compared to:
MD Counties
(2020)
The distribution is based on data from 24 Maryland counties and county equivalents.
MD Value
(11.3)
The regional value is compared to the Maryland State value.
US Value
(13.9)
The regional value is compared to the national value. The source for the national value is Centers for Disease Control and Prevention, National Center for Health Statistics
Prior Value
(8.0)
Prior Value compares a measured value with the previously measured value. Confidence intervals were not taken into account in determining the direction of the comparison.
Trend
This comparison measures the indicator’s values over multiple time periods.<br>The Mann-Kendall Test for Statistical Significance is used to evaluate the trend<br>over 4 to 10 periods of measure, subject to data availability and comparability.
Maryland SHIP 2017
(17.8)
<div><span>The Maryland SHIP 2017 Target is to reduce the teen birth rate to 17.8 births per 1,000 females aged 15-19.</span></div>
Maryland SHIP 2014
(29.6)
<div>
<div><span>The Maryland SHIP 2014 Target is to reduce the teen birth rate to 29.6 births per 1,000 females aged 15-19.</span></div>
</div>
County: Montgomery
Health / Food Safety
Value
Compared to:
County: Montgomery Salmonella Infection Incidence Rate
County: Montgomery Salmonella Infection Incidence Rate
8.5
Cases per 100,000 population
(2020)
Compared to:
MD Counties
The distribution is based on data from 24 Maryland counties and county equivalents.
MD Value
(11.6)
The regional value is compared to the Maryland State value.
US Value
(13.8)
The regional value is compared to the national value. The source for the national value is Centers for Disease Control and Prevention
Prior Value
(14.0)
Prior Value compares a measured value with the previously measured value. Confidence intervals were not taken into account in determining the direction of the comparison.
Trend
This comparison measures the indicator’s values over multiple time periods.<br>The Mann-Kendall Test for Statistical Significance is used to evaluate the trend<br>over 4 to 10 periods of measure, subject to data availability and comparability.
Maryland SHIP 2014
(12.7)
<div>
<div><span>The Maryland SHIP 2014 Target is to reduce the salmonella incidence rate to 12.7 cases per 100,000 population.</span></div>
</div>
HP 2030 Target
(11.5)
County: Montgomery
Health / Health Care Access & Quality
Value
Compared to:
County: Montgomery Adolescents who have had a Routine Checkup: Medicaid Population
County: Montgomery Adolescents who have had a Routine Checkup: Medicaid Population
58.1%
(2021)
Compared to:
MD Counties
The distribution is based on data from 22 Maryland counties and county equivalents.
MD Value
(49.2%)
The regional value is compared to the Maryland State value.
Prior Value
(57.0%)
Prior Value compares a measured value with the previously measured value. Confidence intervals were not taken into account in determining the direction of the comparison.
Trend
This comparison measures the indicator’s values over multiple time periods.<br>The Mann-Kendall Test for Statistical Significance is used to evaluate the trend<br>over 4 to 10 periods of measure, subject to data availability and comparability.
Maryland SHIP 2017
(57.4%)
<div><span>The Maryland SHIP 2017 Target is to increase the proportion of adolescents ages 13 to 20 years old who have had an annual wellness checkup to 57.4%. </span></div>
Maryland SHIP 2014
(54.3%)
<div>
<div><span>The Maryland SHIP 2014 Target is to increase the proportion of adolescents ages 13 to 20 years old who have had an annual wellness checkup to 54.3%. </span></div>
</div>
County: Montgomery Adults Unable to Afford to See a Doctor
County: Montgomery Adults Unable to Afford to See a Doctor
10.9%
(2021)
Compared to:
MD Counties
(2016)
The distribution is based on data from 21 Maryland counties and county equivalents.
MD Value
(9.3%)
The regional value is compared to the Maryland State value.
US Value
(8.7%)
The regional value is compared to the national value. The source for the national value is Behavioral Risk Factor Surveillance System
Prior Value
(10.8%)
Prior Value compares a measured value with the previously measured value. Confidence intervals were taken into account in determining the direction of the comparison.
Trend
This comparison measures the indicator’s values over multiple time periods.<br>The Mann-Kendall Test for Statistical Significance is used to evaluate the trend<br>over 4 to 10 periods of measure, subject to data availability and comparability.
Maryland SHIP 2014
(11.4%)
<div>
<div><span>The Maryland SHIP 2014 Target is to reduce the proportion of adults unable to afford to see a doctor to 11.4%.</span></div>
</div>
County: Montgomery Adults who have had a Routine Checkup
County: Montgomery Adults who have had a Routine Checkup
75.7%
(2022)
Compared to:
MD Counties
The distribution is based on data from 24 Maryland counties.
U.S. Counties
The distribution is based on data from 3,133 U.S. counties and county equivalents.
US Value
(76.1%)
The regional value is compared to the national value.
County: Montgomery Adults with Health Insurance
County: Montgomery Adults with Health Insurance
90.4%
(2018-2022)
Compared to:
MD Counties
The distribution is based on data from 24 Maryland counties.
MD Value
(91.9%)
The regional value is compared to the Maryland State value.
US Value
(87.8%)
The regional value is compared to the national value.
Trend
This comparison measures the indicator’s values over multiple time periods.<br>The Mann-Kendall Test for Statistical Significance is used to evaluate the trend<br>over 4 to 10 periods of measure, subject to data availability and comparability.
County: Montgomery Adults with Medicaid Health Insurance
County: Montgomery Adults with Medicaid Health Insurance
7.8%
(2023)
Compared to:

MD Value
(9.5%)
The regional value is compared to the Maryland State value.
US Value
(11.9%)
The regional value is compared to the national value.
Prior Value
(6.6%)
Prior Value compares a measured value with the previously measured value. Confidence intervals were not taken into account in determining the direction of the comparison.
Trend
This comparison measures the indicator’s values over multiple time periods.<br>The Mann-Kendall Test for Statistical Significance is used to evaluate the trend<br>over 4 to 10 periods of measure, subject to data availability and comparability.
County: Montgomery Adults with Medicare Health Insurance
County: Montgomery Adults with Medicare Health Insurance
17.3%
(2023)
Compared to:
MD Value
(17.1%)
The regional value is compared to the Maryland State value.
US Value
(18.6%)
The regional value is compared to the national value.
Prior Value
(18.3%)
Prior Value compares a measured value with the previously measured value. Confidence intervals were not taken into account in determining the direction of the comparison.
Trend
This comparison measures the indicator’s values over multiple time periods.<br>The Mann-Kendall Test for Statistical Significance is used to evaluate the trend<br>over 4 to 10 periods of measure, subject to data availability and comparability.
County: Montgomery Adults without Health Insurance
County: Montgomery Adults without Health Insurance
7.3%
(2022)
Compared to:
MD Counties
The distribution is based on data from 24 Maryland counties.
U.S. Counties
The distribution is based on data from 3,133 U.S. counties and county equivalents.
US Value
(10.8%)
The regional value is compared to the national value.
County: Montgomery Children with Health Insurance
County: Montgomery Children with Health Insurance
95.6%
(2023)
Compared to:

U.S. Counties
The distribution is based on data from 834 U.S. counties and county equivalents.
MD Value
(95.3%)
The regional value is compared to the Maryland State value.
US Value
(94.6%)
The regional value is compared to the national value.
Prior Value
(96.7%)
Prior Value compares a measured value with the previously measured value. Confidence intervals were taken into account in determining the direction of the comparison.
Trend
This comparison measures the indicator’s values over multiple time periods.<br>The Mann-Kendall Test for Statistical Significance is used to evaluate the trend<br>over 4 to 10 periods of measure, subject to data availability and comparability.
County: Montgomery Households that Received Cardiology Medical Services
County: Montgomery Households that Received Cardiology Medical Services
11.3%
(2023)
Compared to:
MD Value
(11.4%)
The regional value is compared to the Maryland State value.
US Value
(11.8%)
The regional value is compared to the national value.
Prior Value
(11.4%)
Prior Value compares a measured value with the previously measured value. Confidence intervals were not taken into account in determining the direction of the comparison.
Trend
This comparison measures the indicator’s values over multiple time periods.<br>The Mann-Kendall Test for Statistical Significance is used to evaluate the trend<br>over 4 to 10 periods of measure, subject to data availability and comparability.
County: Montgomery Households that Received Maternity Care Services
County: Montgomery Households that Received Maternity Care Services
6.2%
(2023)
Compared to:
MD Value
(6.2%)
The regional value is compared to the Maryland State value.
US Value
(5.8%)
The regional value is compared to the national value.
Prior Value
(6.2%)
Prior Value compares a measured value with the previously measured value. Confidence intervals were not taken into account in determining the direction of the comparison.
Trend
This comparison measures the indicator’s values over multiple time periods.<br>The Mann-Kendall Test for Statistical Significance is used to evaluate the trend<br>over 4 to 10 periods of measure, subject to data availability and comparability.
County: Montgomery Households that Received Medical Services in an Emergency Room
County: Montgomery Households that Received Medical Services in an Emergency Room
26.9%
(2023)
Compared to:

MD Value
(27.8%)
The regional value is compared to the Maryland State value.
US Value
(28.0%)
The regional value is compared to the national value.
Prior Value
(27.8%)
Prior Value compares a measured value with the previously measured value. Confidence intervals were not taken into account in determining the direction of the comparison.
Trend
This comparison measures the indicator’s values over multiple time periods.<br>The Mann-Kendall Test for Statistical Significance is used to evaluate the trend<br>over 4 to 10 periods of measure, subject to data availability and comparability.
County: Montgomery Households that Received Medical Services in an Urgent Care Facility
County: Montgomery Households that Received Medical Services in an Urgent Care Facility
29.4%
(2023)
Compared to:
MD Value
(28.1%)
The regional value is compared to the Maryland State value.
US Value
(25.9%)
The regional value is compared to the national value.
Prior Value
(28.3%)
Prior Value compares a measured value with the previously measured value. Confidence intervals were not taken into account in determining the direction of the comparison.
Trend
This comparison measures the indicator’s values over multiple time periods.<br>The Mann-Kendall Test for Statistical Significance is used to evaluate the trend<br>over 4 to 10 periods of measure, subject to data availability and comparability.
County: Montgomery Households that Received Pediatric Medical Services
County: Montgomery Households that Received Pediatric Medical Services
12.7%
(2023)
Compared to:
MD Value
(12.1%)
The regional value is compared to the Maryland State value.
US Value
(10.8%)
The regional value is compared to the national value.
Prior Value
(11.7%)
Prior Value compares a measured value with the previously measured value. Confidence intervals were not taken into account in determining the direction of the comparison.
Trend
This comparison measures the indicator’s values over multiple time periods.<br>The Mann-Kendall Test for Statistical Significance is used to evaluate the trend<br>over 4 to 10 periods of measure, subject to data availability and comparability.
County: Montgomery Non-Physician Primary Care Provider Rate
County: Montgomery Non-Physician Primary Care Provider Rate
118
Providers per 100,000 population
(2023)
Compared to:
MD Counties
The distribution is based on data from 24 Maryland counties.
U.S. Counties
The distribution is based on data from 3,129 U.S. counties and county equivalents.
MD Value
(137)
The regional value is compared to the Maryland State value.
Prior Value
(111)
Prior Value compares a measured value with the previously measured value. Confidence intervals were not taken into account in determining the direction of the comparison.
Trend
This comparison measures the indicator’s values over multiple time periods.<br>The Mann-Kendall Test for Statistical Significance is used to evaluate the trend<br>over 4 to 10 periods of measure, subject to data availability and comparability.
County: Montgomery Persons with Health Insurance
County: Montgomery Persons with Health Insurance
92.3%
(2022)
Compared to:
MD Counties
The distribution is based on data from 24 Maryland counties.
U.S. Counties
The distribution is based on data from 3,132 U.S. counties and county equivalents.
MD Value
(93.2%)
The regional value is compared to the Maryland State value.
Prior Value
(92.7%)
Prior Value compares a measured value with the previously measured value. Confidence intervals were taken into account in determining the direction of the comparison.
Trend
This comparison measures the indicator’s values over multiple time periods.<br>The Mann-Kendall Test for Statistical Significance is used to evaluate the trend<br>over 4 to 10 periods of measure, subject to data availability and comparability.
Maryland SHIP 2014
(93.6%)
<div>
<div><span>The Maryland SHIP 2014 Target is to increase the proportion of persons under age 65 years with health insurance to 93.6%.</span></div>
</div>
HP 2030 Target
(92.4%)
<div>AHS-01: Increase the proportion of people with health insurance <strong>(LEADING HEALTH INDICATOR)</strong></div>
County: Montgomery Persons with Private Health Insurance Only
County: Montgomery Persons with Private Health Insurance Only
62.7%
(2023)
Compared to:
MD Value
(59.1%)
The regional value is compared to the Maryland State value.
US Value
(54.7%)
The regional value is compared to the national value.
Prior Value
(61.1%)
Prior Value compares a measured value with the previously measured value. Confidence intervals were not taken into account in determining the direction of the comparison.
Trend
This comparison measures the indicator’s values over multiple time periods.<br>The Mann-Kendall Test for Statistical Significance is used to evaluate the trend<br>over 4 to 10 periods of measure, subject to data availability and comparability.
County: Montgomery Persons with Public Health Insurance Only
County: Montgomery Persons with Public Health Insurance Only
16.9%
(2023)
Compared to:
MD Value
(20.6%)
The regional value is compared to the Maryland State value.
US Value
(25.1%)
The regional value is compared to the national value.
Prior Value
(18.6%)
Prior Value compares a measured value with the previously measured value. Confidence intervals were not taken into account in determining the direction of the comparison.
Trend
This comparison measures the indicator’s values over multiple time periods.<br>The Mann-Kendall Test for Statistical Significance is used to evaluate the trend<br>over 4 to 10 periods of measure, subject to data availability and comparability.
County: Montgomery Preventable Hospital Stays: Medicare Population
County: Montgomery Preventable Hospital Stays: Medicare Population
1,516
Discharges per 100,000 Medicare enrollees
(2022)
Compared to:
MD Counties
The distribution is based on data from 24 Maryland counties.
U.S. Counties
The distribution is based on data from 3,129 U.S. counties and county equivalents.
MD Value
(2,547)
The regional value is compared to the Maryland State value.
US Value
(2,677)
The regional value is compared to the national value.
Prior Value
(1,541)
Prior Value compares a measured value with the previously measured value. Confidence intervals were not taken into account in determining the direction of the comparison.
Trend
This comparison measures the indicator’s values over multiple time periods.<br>The Mann-Kendall Test for Statistical Significance is used to evaluate the trend<br>over 4 to 10 periods of measure, subject to data availability and comparability.
County: Montgomery Primary Care Provider Rate
County: Montgomery Primary Care Provider Rate
135
Providers per 100,000 population
(2021)
Compared to:
MD Counties
The distribution is based on data from 24 Maryland counties.
U.S. Counties
The distribution is based on data from 2,984 U.S. counties and county equivalents.
MD Value
(85)
The regional value is compared to the Maryland State value.
Prior Value
(138)
Prior Value compares a measured value with the previously measured value. Confidence intervals were not taken into account in determining the direction of the comparison.
Trend
This comparison measures the indicator’s values over multiple time periods.<br>The Mann-Kendall Test for Statistical Significance is used to evaluate the trend<br>over 4 to 10 periods of measure, subject to data availability and comparability.
County: Montgomery
Health / Health Information Technology
Value
Compared to:
County: Montgomery Adults Who Access Medical Services and Information through the Internet
County: Montgomery Adults Who Access Medical Services and Information through the Internet
37.9%
(2023)
Compared to:
MD Value
(34.3%)
The regional value is compared to the Maryland State value.
US Value
(31.8%)
The regional value is compared to the national value.
Prior Value
(36.1%)
Prior Value compares a measured value with the previously measured value. Confidence intervals were not taken into account in determining the direction of the comparison.
County: Montgomery Adults with Internet Access
County: Montgomery Adults with Internet Access
100.0%
(2023)
Compared to:
MD Counties
The distribution is based on data from 24 Maryland counties.
U.S. Counties
The distribution is based on data from 3,141 U.S. counties and county equivalents.
MD Value
(95.2%)
The regional value is compared to the Maryland State value.
US Value
(91.7%)
The regional value is compared to the national value.
Prior Value
(97.8%)
Prior Value compares a measured value with the previously measured value. Confidence intervals were not taken into account in determining the direction of the comparison.
Trend
This comparison measures the indicator’s values over multiple time periods.<br>The Mann-Kendall Test for Statistical Significance is used to evaluate the trend<br>over 4 to 10 periods of measure, subject to data availability and comparability.
County: Montgomery Households with a Computer
County: Montgomery Households with a Computer
93.3%
(2023)
Compared to:
MD Counties
The distribution is based on data from 24 Maryland counties.
U.S. Counties
The distribution is based on data from 3,141 U.S. counties and county equivalents.
MD Value
(91.0%)
The regional value is compared to the Maryland State value.
US Value
(88.2%)
The regional value is compared to the national value.
Prior Value
(92.9%)
Prior Value compares a measured value with the previously measured value. Confidence intervals were not taken into account in determining the direction of the comparison.
Trend
This comparison measures the indicator’s values over multiple time periods.<br>The Mann-Kendall Test for Statistical Significance is used to evaluate the trend<br>over 4 to 10 periods of measure, subject to data availability and comparability.
County: Montgomery Households with a Smartphone
County: Montgomery Households with a Smartphone
89.5%
(2023)
Compared to:
MD Counties
The distribution is based on data from 24 Maryland counties.
U.S. Counties
The distribution is based on data from 3,141 U.S. counties and county equivalents.
MD Value
(87.6%)
The regional value is compared to the Maryland State value.
US Value
(84.7%)
The regional value is compared to the national value.
Prior Value
(88.2%)
Prior Value compares a measured value with the previously measured value. Confidence intervals were not taken into account in determining the direction of the comparison.
Trend
This comparison measures the indicator’s values over multiple time periods.<br>The Mann-Kendall Test for Statistical Significance is used to evaluate the trend<br>over 4 to 10 periods of measure, subject to data availability and comparability.
County: Montgomery Households with an Internet Subscription
County: Montgomery Households with an Internet Subscription
94.8%
(2018-2022)
Compared to:
MD Counties
The distribution is based on data from 24 Maryland counties.
U.S. Counties
The distribution is based on data from 3,133 U.S. counties and county equivalents.
MD Value
(90.7%)
The regional value is compared to the Maryland State value.
US Value
(88.5%)
The regional value is compared to the national value.
Trend
This comparison measures the indicator’s values over multiple time periods.<br>The Mann-Kendall Test for Statistical Significance is used to evaluate the trend<br>over 4 to 10 periods of measure, subject to data availability and comparability.
County: Montgomery Households with One or More Types of Computing Devices
County: Montgomery Households with One or More Types of Computing Devices
97.7%
(2018-2022)
Compared to:
MD Counties
The distribution is based on data from 24 Maryland counties.
U.S. Counties
The distribution is based on data from 3,133 U.S. counties and county equivalents.
MD Value
(95.3%)
The regional value is compared to the Maryland State value.
US Value
(94.0%)
The regional value is compared to the national value.
Trend
This comparison measures the indicator’s values over multiple time periods.<br>The Mann-Kendall Test for Statistical Significance is used to evaluate the trend<br>over 4 to 10 periods of measure, subject to data availability and comparability.
County: Montgomery Persons with an Internet Subscription
County: Montgomery Persons with an Internet Subscription
95.8%
(2018-2022)
Compared to:
MD Counties
The distribution is based on data from 24 Maryland counties.
U.S. Counties
The distribution is based on data from 3,133 U.S. counties and county equivalents.
MD Value
(93.0%)
The regional value is compared to the Maryland State value.
US Value
(91.0%)
The regional value is compared to the national value.
Trend
This comparison measures the indicator’s values over multiple time periods.<br>The Mann-Kendall Test for Statistical Significance is used to evaluate the trend<br>over 4 to 10 periods of measure, subject to data availability and comparability.
County: Montgomery
Health / Heart Disease & Stroke
Value
Compared to:
County: Montgomery Adults Who Bought Medications for Cholesterol
County: Montgomery Adults Who Bought Medications for Cholesterol
17.0%
(2023)
Compared to:
MD Value
(17.0%)
The regional value is compared to the Maryland State value.
US Value
(17.1%)
The regional value is compared to the national value.
Prior Value
(17.0%)
Prior Value compares a measured value with the previously measured value. Confidence intervals were not taken into account in determining the direction of the comparison.
Trend
This comparison measures the indicator’s values over multiple time periods.<br>The Mann-Kendall Test for Statistical Significance is used to evaluate the trend<br>over 4 to 10 periods of measure, subject to data availability and comparability.
County: Montgomery Adults Who Bought Medications for High Blood Pressure
County: Montgomery Adults Who Bought Medications for High Blood Pressure
22.0%
(2023)
Compared to:
MD Value
(23.3%)
The regional value is compared to the Maryland State value.
US Value
(24.4%)
The regional value is compared to the national value.
Prior Value
(21.9%)
Prior Value compares a measured value with the previously measured value. Confidence intervals were not taken into account in determining the direction of the comparison.
Trend
This comparison measures the indicator’s values over multiple time periods.<br>The Mann-Kendall Test for Statistical Significance is used to evaluate the trend<br>over 4 to 10 periods of measure, subject to data availability and comparability.
County: Montgomery Adults who Experienced a Stroke
County: Montgomery Adults who Experienced a Stroke
2.8%
(2022)
Compared to:
MD Counties
The distribution is based on data from 24 Maryland counties.
U.S. Counties
The distribution is based on data from 3,133 U.S. counties and county equivalents.
US Value
(3.6%)
The regional value is compared to the national value.
County: Montgomery Adults who Experienced Coronary Heart Disease
County: Montgomery Adults who Experienced Coronary Heart Disease
5.1%
(2022)
Compared to:
MD Counties
The distribution is based on data from 24 Maryland counties.
U.S. Counties
The distribution is based on data from 3,132 U.S. counties and county equivalents.
US Value
(6.8%)
The regional value is compared to the national value.
County: Montgomery Adults who Have Taken Medications for High Blood Pressure
County: Montgomery Adults who Have Taken Medications for High Blood Pressure
78.0%
(2021)
Compared to:
MD Counties
The distribution is based on data from 24 Maryland counties.
U.S. Counties
The distribution is based on data from 3,066 U.S. counties and county equivalents.
US Value
(78.2%)
The regional value is compared to the national value.
County: Montgomery Adults Who Visited a Cardiologist
County: Montgomery Adults Who Visited a Cardiologist
13.8%
(2023)
Compared to:
MD Value
(13.2%)
The regional value is compared to the Maryland State value.
US Value
(13.2%)
The regional value is compared to the national value.
Prior Value
(12.9%)
Prior Value compares a measured value with the previously measured value. Confidence intervals were not taken into account in determining the direction of the comparison.
Trend
This comparison measures the indicator’s values over multiple time periods.<br>The Mann-Kendall Test for Statistical Significance is used to evaluate the trend<br>over 4 to 10 periods of measure, subject to data availability and comparability.
County: Montgomery Age-Adjusted Death Rate due to Cerebrovascular Disease (Stroke)
County: Montgomery Age-Adjusted Death Rate due to Cerebrovascular Disease (Stroke)
26.3
Deaths per 100,000 population
(2019-2021)
Compared to:
MD Counties
The distribution is based on data from 21 Maryland counties and county equivalents.
MD Value
(45.5)
The regional value is compared to the Maryland State value.
US Value
(38.8 in 2020)
The regional value is compared to the national value. The source for the national value is Centers for Disease Control and Prevention
Prior Value
(28.2)
Prior Value compares a measured value with the previously measured value. Confidence intervals were not taken into account in determining the direction of the comparison.
Trend
This comparison measures the indicator’s values over multiple time periods.<br>The Mann-Kendall Test for Statistical Significance is used to evaluate the trend<br>over 4 to 10 periods of measure, subject to data availability and comparability.
HP 2030 Target
(33.4)
County: Montgomery Age-Adjusted Death Rate due to Coronary Heart Disease
County: Montgomery Age-Adjusted Death Rate due to Coronary Heart Disease
50.2
Deaths per 100,000 population
(2018-2020)
Compared to:
MD Counties
The distribution is based on data from 24 Maryland counties.
U.S. Counties
The distribution is based on data from 2,852 U.S. counties and county equivalents.
MD Value
(89.7)
The regional value is compared to the Maryland State value.
US Value
(90.2)
The regional value is compared to the national value.
Prior Value
(51.3)
Prior Value compares a measured value with the previously measured value. Confidence intervals were taken into account in determining the direction of the comparison.
Trend
This comparison measures the indicator’s values over multiple time periods.<br>The Mann-Kendall Test for Statistical Significance is used to evaluate the trend<br>over 4 to 10 periods of measure, subject to data availability and comparability.
HP 2030 Target
(71.1)
County: Montgomery Age-Adjusted Death Rate due to Heart Attack
County: Montgomery Age-Adjusted Death Rate due to Heart Attack
29.8
Deaths per 100,000 population 35+ years
(2021)
Compared to:
MD Counties
The distribution is based on data from 24 Maryland counties.
U.S. Counties
The distribution is based on data from 3,101 U.S. counties and county equivalents.
MD Value
(42.4)
The regional value is compared to the Maryland State value.
Prior Value
(29.4)
Prior Value compares a measured value with the previously measured value. Confidence intervals were not taken into account in determining the direction of the comparison.
Trend
This comparison measures the indicator’s values over multiple time periods.<br>The Mann-Kendall Test for Statistical Significance is used to evaluate the trend<br>over 4 to 10 periods of measure, subject to data availability and comparability.
County: Montgomery Age-Adjusted Death Rate due to Heart Disease
County: Montgomery Age-Adjusted Death Rate due to Heart Disease
97.5
Deaths per 100,000 population
(2019-2021)
Compared to:
MD Counties
The distribution is based on data from 24 Maryland counties and county equivalents.
MD Value
(160.1)
The regional value is compared to the Maryland State value.
US Value
(164.5 in 2018-2020)
The regional value is compared to the national value. The source for the national value is Centers for Disease Control and Prevention
Prior Value
(96.4)
Prior Value compares a measured value with the previously measured value. Confidence intervals were not taken into account in determining the direction of the comparison.
Trend
This comparison measures the indicator’s values over multiple time periods.<br>The Mann-Kendall Test for Statistical Significance is used to evaluate the trend<br>over 4 to 10 periods of measure, subject to data availability and comparability.
Maryland SHIP 2017
(166.3)
<div><span>The Maryland SHIP 2017 Target is to reduce the heart disease death rate to 166.3 deaths per 100,000 population.</span></div>
Maryland SHIP 2014
(173.4)
<div>
<div><span>The Maryland SHIP 2014 Target is to reduce the heart disease death rate to 173.4 deaths per 100,000 population.</span></div>
</div>
County: Montgomery Age-Adjusted Hospitalization Rate due to Heart Attack
County: Montgomery Age-Adjusted Hospitalization Rate due to Heart Attack
13.1
Hospitalizations per 10,000 population 35+ years
(2020)
Compared to:
MD Counties
The distribution is based on data from 24 Maryland counties.
MD Value
(19.2)
The regional value is compared to the Maryland State value.
Prior Value
(15.7)
Prior Value compares a measured value with the previously measured value. Confidence intervals were not taken into account in determining the direction of the comparison.
Trend
This comparison measures the indicator’s values over multiple time periods.<br>The Mann-Kendall Test for Statistical Significance is used to evaluate the trend<br>over 4 to 10 periods of measure, subject to data availability and comparability.
County: Montgomery Atrial Fibrillation: Medicare Population
County: Montgomery Atrial Fibrillation: Medicare Population
12.0%
(2022)
Compared to:
MD Counties
The distribution is based on data from 24 Maryland counties.
U.S. Counties
The distribution is based on data from 3,129 U.S. counties and county equivalents.
MD Value
(13.0%)
The regional value is compared to the Maryland State value.
US Value
(14.0%)
The regional value is compared to the national value.
Prior Value
(12.0%)
Prior Value compares a measured value with the previously measured value. Confidence intervals were not taken into account in determining the direction of the comparison.
Trend
This comparison measures the indicator’s values over multiple time periods.<br>The Mann-Kendall Test for Statistical Significance is used to evaluate the trend<br>over 4 to 10 periods of measure, subject to data availability and comparability.
County: Montgomery Cholesterol Test History
County: Montgomery Cholesterol Test History
90.3%
(2021)
Compared to:
MD Counties
The distribution is based on data from 24 Maryland counties.
U.S. Counties
The distribution is based on data from 3,066 U.S. counties and county equivalents.
US Value
(86.4%)
The regional value is compared to the national value.
County: Montgomery Heart Failure: Medicare Population
County: Montgomery Heart Failure: Medicare Population
8.0%
(2022)
Compared to:
MD Counties
The distribution is based on data from 24 Maryland counties.
U.S. Counties
The distribution is based on data from 3,129 U.S. counties and county equivalents.
MD Value
(9.0%)
The regional value is compared to the Maryland State value.
US Value
(11.0%)
The regional value is compared to the national value.
Prior Value
(8.0%)
Prior Value compares a measured value with the previously measured value. Confidence intervals were not taken into account in determining the direction of the comparison.
Trend
This comparison measures the indicator’s values over multiple time periods.<br>The Mann-Kendall Test for Statistical Significance is used to evaluate the trend<br>over 4 to 10 periods of measure, subject to data availability and comparability.
County: Montgomery High Blood Pressure Prevalence
County: Montgomery High Blood Pressure Prevalence
30.1%
(2021)
Compared to:
MD Counties
The distribution is based on data from 24 Maryland counties.
U.S. Counties
The distribution is based on data from 3,066 U.S. counties and county equivalents.
US Value
(32.7%)
The regional value is compared to the national value.
HP 2030 Target
(41.9%)
County: Montgomery High Cholesterol Prevalence
County: Montgomery High Cholesterol Prevalence
39.6%
(2021)
Compared to:
MD Counties
The distribution is based on data from 24 Maryland counties and county equivalents.
MD Value
(33.5%)
The regional value is compared to the Maryland State value.
US Value
(35.7%)
The regional value is compared to the national value. The source for the national value is Behavioral Risk Factor Surveillance System
Prior Value
(33.8%)
Prior Value compares a measured value with the previously measured value. Confidence intervals were taken into account in determining the direction of the comparison.
Trend
This comparison measures the indicator’s values over multiple time periods.<br>The Mann-Kendall Test for Statistical Significance is used to evaluate the trend<br>over 4 to 10 periods of measure, subject to data availability and comparability.
County: Montgomery High Cholesterol Prevalence: Past 5 Years
County: Montgomery High Cholesterol Prevalence: Past 5 Years
33.4%
(2019)
Compared to:
MD Counties
The distribution is based on data from 24 Maryland counties.
U.S. Counties
The distribution is based on data from 3,121 U.S. counties and county equivalents.
US Value
(33.6%)
The regional value is compared to the national value.
County: Montgomery Hyperlipidemia: Medicare Population
County: Montgomery Hyperlipidemia: Medicare Population
67.0%
(2022)
Compared to:
MD Counties
The distribution is based on data from 24 Maryland counties.
U.S. Counties
The distribution is based on data from 3,129 U.S. counties and county equivalents.
MD Value
(69.0%)
The regional value is compared to the Maryland State value.
US Value
(65.0%)
The regional value is compared to the national value.
Prior Value
(65.0%)
Prior Value compares a measured value with the previously measured value. Confidence intervals were not taken into account in determining the direction of the comparison.
Trend
This comparison measures the indicator’s values over multiple time periods.<br>The Mann-Kendall Test for Statistical Significance is used to evaluate the trend<br>over 4 to 10 periods of measure, subject to data availability and comparability.
County: Montgomery Hypertension: Medicare Population
County: Montgomery Hypertension: Medicare Population
62.0%
(2022)
Compared to:
MD Counties
The distribution is based on data from 24 Maryland counties.
U.S. Counties
The distribution is based on data from 3,129 U.S. counties and county equivalents.
MD Value
(68.0%)
The regional value is compared to the Maryland State value.
US Value
(65.0%)
The regional value is compared to the national value.
Prior Value
(62.0%)
Prior Value compares a measured value with the previously measured value. Confidence intervals were not taken into account in determining the direction of the comparison.
Trend
This comparison measures the indicator’s values over multiple time periods.<br>The Mann-Kendall Test for Statistical Significance is used to evaluate the trend<br>over 4 to 10 periods of measure, subject to data availability and comparability.
County: Montgomery Ischemic Heart Disease: Medicare Population
County: Montgomery Ischemic Heart Disease: Medicare Population
18.0%
(2022)
Compared to:
MD Counties
The distribution is based on data from 24 Maryland counties.
U.S. Counties
The distribution is based on data from 3,129 U.S. counties and county equivalents.
MD Value
(20.0%)
The regional value is compared to the Maryland State value.
US Value
(21.0%)
The regional value is compared to the national value.
Prior Value
(17.0%)
Prior Value compares a measured value with the previously measured value. Confidence intervals were not taken into account in determining the direction of the comparison.
Trend
This comparison measures the indicator’s values over multiple time periods.<br>The Mann-Kendall Test for Statistical Significance is used to evaluate the trend<br>over 4 to 10 periods of measure, subject to data availability and comparability.
County: Montgomery Stroke: Medicare Population
County: Montgomery Stroke: Medicare Population
7.0%
(2022)
Compared to:
MD Counties
The distribution is based on data from 24 Maryland counties.
U.S. Counties
The distribution is based on data from 3,129 U.S. counties and county equivalents.
MD Value
(6.0%)
The regional value is compared to the Maryland State value.
US Value
(6.0%)
The regional value is compared to the national value.
Prior Value
(7.0%)
Prior Value compares a measured value with the previously measured value. Confidence intervals were not taken into account in determining the direction of the comparison.
Trend
This comparison measures the indicator’s values over multiple time periods.<br>The Mann-Kendall Test for Statistical Significance is used to evaluate the trend<br>over 4 to 10 periods of measure, subject to data availability and comparability.
County: Montgomery
Health / Immunizations & Infectious Diseases
Value
Compared to:
County: Montgomery Adults 65+ with Influenza Vaccination
County: Montgomery Adults 65+ with Influenza Vaccination
55.1%
(2021)
Compared to:
MD Counties
The distribution is based on data from 24 Maryland counties and county equivalents.
MD Value
(49.8%)
The regional value is compared to the Maryland State value.
US Value
(68.6%)
The regional value is compared to the national value. The source for the national value is Behavioral Risk Factor Surveillance System
Prior Value
(70.6%)
Prior Value compares a measured value with the previously measured value. Confidence intervals were taken into account in determining the direction of the comparison.
Trend
This comparison measures the indicator’s values over multiple time periods.<br>The Mann-Kendall Test for Statistical Significance is used to evaluate the trend<br>over 4 to 10 periods of measure, subject to data availability and comparability.
County: Montgomery Adults 65+ with Pneumonia Vaccination
County: Montgomery Adults 65+ with Pneumonia Vaccination
29.5%
(2021)
Compared to:
MD Counties
The distribution is based on data from 24 Maryland counties and county equivalents.
MD Value
(33.2%)
The regional value is compared to the Maryland State value.
US Value
(71.0%)
The regional value is compared to the national value. The source for the national value is Behavioral Risk Factor Surveillance System
Prior Value
(77.3%)
Prior Value compares a measured value with the previously measured value. Confidence intervals were taken into account in determining the direction of the comparison.
Trend
This comparison measures the indicator’s values over multiple time periods.<br>The Mann-Kendall Test for Statistical Significance is used to evaluate the trend<br>over 4 to 10 periods of measure, subject to data availability and comparability.
County: Montgomery Age-Adjusted Death Rate due to Influenza and Pneumonia
County: Montgomery Age-Adjusted Death Rate due to Influenza and Pneumonia
7.3
Deaths per 100,000 population
(2019-2021)
Compared to:
MD Value
(8.4)
The regional value is compared to the Maryland State value.
US Value
(13.0 in 2020)
The regional value is compared to the national value. The source for the national value is Centers for Disease Control and Prevention
Prior Value
(9.5)
Prior Value compares a measured value with the previously measured value. Confidence intervals were not taken into account in determining the direction of the comparison.
Trend
This comparison measures the indicator’s values over multiple time periods.<br>The Mann-Kendall Test for Statistical Significance is used to evaluate the trend<br>over 4 to 10 periods of measure, subject to data availability and comparability.
County: Montgomery Flu Vaccinations: Medicare Population
County: Montgomery Flu Vaccinations: Medicare Population
60.0%
(2022)
Compared to:
MD Counties
The distribution is based on data from 24 Maryland counties.
U.S. Counties
The distribution is based on data from 3,129 U.S. counties and county equivalents.
MD Value
(54.0%)
The regional value is compared to the Maryland State value.
US Value
(50.0%)
The regional value is compared to the national value.
Prior Value
(59.0%)
Prior Value compares a measured value with the previously measured value. Confidence intervals were not taken into account in determining the direction of the comparison.
Trend
This comparison measures the indicator’s values over multiple time periods.<br>The Mann-Kendall Test for Statistical Significance is used to evaluate the trend<br>over 4 to 10 periods of measure, subject to data availability and comparability.
County: Montgomery Pneumonia Vaccinations: Medicare Population
County: Montgomery Pneumonia Vaccinations: Medicare Population
8.0%
(2022)
Compared to:
MD Counties
The distribution is based on data from 24 Maryland counties.
U.S. Counties
The distribution is based on data from 3,129 U.S. counties and county equivalents.
MD Value
(8.0%)
The regional value is compared to the Maryland State value.
US Value
(8.0%)
The regional value is compared to the national value.
Prior Value
(6.0%)
Prior Value compares a measured value with the previously measured value. Confidence intervals were not taken into account in determining the direction of the comparison.
Trend
This comparison measures the indicator’s values over multiple time periods.<br>The Mann-Kendall Test for Statistical Significance is used to evaluate the trend<br>over 4 to 10 periods of measure, subject to data availability and comparability.
County: Montgomery Tuberculosis Incidence Rate
County: Montgomery Tuberculosis Incidence Rate
5.4
Cases per 100,000 population
(2020)
Compared to:
MD Counties
(2018)
The distribution is based on data from 24 Maryland counties and county equivalents.
MD Value
(2.4)
The regional value is compared to the Maryland State value.
US Value
(2.2)
The regional value is compared to the national value. The source for the national value is Centers for Disease Control and Prevention
Prior Value
(5.9)
Prior Value compares a measured value with the previously measured value. Confidence intervals were not taken into account in determining the direction of the comparison.
Trend
This comparison measures the indicator’s values over multiple time periods.<br>The Mann-Kendall Test for Statistical Significance is used to evaluate the trend<br>over 4 to 10 periods of measure, subject to data availability and comparability.
HP 2030 Target
(1.4)
County: Montgomery
Health / Maternal, Fetal & Infant Health
Value
Compared to:
County: Montgomery Babies with Low Birthweight
County: Montgomery Babies with Low Birthweight
7.6%
(2021)
Compared to:
MD Counties
The distribution is based on data from 23 Maryland counties and county equivalents.
MD Value
(8.9%)
The regional value is compared to the Maryland State value.
US Value
(8.5%)
The regional value is compared to the national value. The source for the national value is Centers for Disease Control and Prevention
Prior Value
(7.3%)
Prior Value compares a measured value with the previously measured value. Confidence intervals were not taken into account in determining the direction of the comparison.
Trend
This comparison measures the indicator’s values over multiple time periods.<br>The Mann-Kendall Test for Statistical Significance is used to evaluate the trend<br>over 4 to 10 periods of measure, subject to data availability and comparability.
Maryland SHIP 2017
(8.0%)
<div><span>The Maryland SHIP 2017 Target is to reduce the proportion of births that are low weight to 8.0%.</span></div>
Maryland SHIP 2014
(8.5%)
<div>
<div><span>The Maryland SHIP 2014 Target is to reduce the proportion of births that are low weight to 8.5%.</span></div>
</div>
County: Montgomery Babies with Very Low Birthweight
County: Montgomery Babies with Very Low Birthweight
1.4%
(2021)
Compared to:
MD Value
(1.6%)
The regional value is compared to the Maryland State value.
US Value
(1.4%)
The regional value is compared to the national value. The source for the national value is Centers for Disease Control and Prevention
Prior Value
(1.3%)
Prior Value compares a measured value with the previously measured value. Confidence intervals were not taken into account in determining the direction of the comparison.
Trend
This comparison measures the indicator’s values over multiple time periods.<br>The Mann-Kendall Test for Statistical Significance is used to evaluate the trend<br>over 4 to 10 periods of measure, subject to data availability and comparability.
County: Montgomery Infant Mortality Rate
County: Montgomery Infant Mortality Rate
5.2
Deaths per 1,000 live births
(2021)
Compared to:
MD Value
(6.1)
The regional value is compared to the Maryland State value.
US Value
(5.4)
The regional value is compared to the national value. The source for the national value is Centers for Disease Control and Prevention
Prior Value
(5.2)
Prior Value compares a measured value with the previously measured value. Confidence intervals were not taken into account in determining the direction of the comparison.
Trend
This comparison measures the indicator’s values over multiple time periods.<br>The Mann-Kendall Test for Statistical Significance is used to evaluate the trend<br>over 4 to 10 periods of measure, subject to data availability and comparability.
Maryland SHIP 2017
(6.3)
<div><span>The Maryland SHIP 2017 Target is to reduce the infant mortality rate to 6.3 deaths per 1,000 live births. </span></div>
Maryland SHIP 2014
(6.6)
<div>
<div><span>The Maryland SHIP 2014 Target is to reduce the infant mortality rate to 6.6 deaths per 1,000 live births. </span></div>
</div>
HP 2030 Target
(5.0)
<div>MICH-02: Reduce the rate of infant deaths <strong>(LEADING HEALTH INDICATOR)</strong></div>
County: Montgomery Mothers who Received Early Prenatal Care
County: Montgomery Mothers who Received Early Prenatal Care
65.6%
(2021)
Compared to:
MD Counties
The distribution is based on data from 24 Maryland counties and county equivalents.
MD Value
(69.1%)
The regional value is compared to the Maryland State value.
US Value
(78.3%)
The regional value is compared to the national value. The source for the national value is Centers for Disease Control and Prevention
Prior Value
(67.5%)
Prior Value compares a measured value with the previously measured value. Confidence intervals were not taken into account in determining the direction of the comparison.
Trend
This comparison measures the indicator’s values over multiple time periods.<br>The Mann-Kendall Test for Statistical Significance is used to evaluate the trend<br>over 4 to 10 periods of measure, subject to data availability and comparability.
Maryland SHIP 2017
(66.9%)
<div><span>The Maryland SHIP 2017 Target is to increase the proportion of pregnant women who receive prenatal care beginning in the first trimester to 66.9%.</span></div>
Maryland SHIP 2014
(84.2%)
<div>
<div><span>The Maryland SHIP 2014 Target is to increase the proportion of pregnant women who receive prenatal care beginning in the first trimester to 84.2%.</span></div>
</div>
County: Montgomery Preterm Births
County: Montgomery Preterm Births
9.4%
(2021)
Compared to:
MD Counties
(2019)
The distribution is based on data from 24 Maryland counties and county equivalents.
MD Value
(10.7%)
The regional value is compared to the Maryland State value.
US Value
(10.5%)
The regional value is compared to the national value. The source for the national value is Centers for Disease Control and Prevention
Prior Value
(8.9%)
Prior Value compares a measured value with the previously measured value. Confidence intervals were not taken into account in determining the direction of the comparison.
Trend
This comparison measures the indicator’s values over multiple time periods.<br>The Mann-Kendall Test for Statistical Significance is used to evaluate the trend<br>over 4 to 10 periods of measure, subject to data availability and comparability.
HP 2030 Target
(9.4%)
County: Montgomery
Health / Medications & Prescriptions
Value
Compared to:
County: Montgomery Adults who Bought Medications for Anxiety or Depression
County: Montgomery Adults who Bought Medications for Anxiety or Depression
14.2%
(2023)
Compared to:
MD Value
(14.6%)
The regional value is compared to the Maryland State value.
US Value
(14.9%)
The regional value is compared to the national value.
Prior Value
(14.2%)
Prior Value compares a measured value with the previously measured value. Confidence intervals were not taken into account in determining the direction of the comparison.
County: Montgomery
Health / Mental Health & Mental Disorders
Value
Compared to:
County: Montgomery Adults Ever Diagnosed with Depression
County: Montgomery Adults Ever Diagnosed with Depression
18.3%
(2022)
Compared to:
MD Counties
The distribution is based on data from 24 Maryland counties.
U.S. Counties
The distribution is based on data from 3,133 U.S. counties and county equivalents.
US Value
(20.7%)
The regional value is compared to the national value.
County: Montgomery Age-Adjusted Mortality due to Suicide
County: Montgomery Age-Adjusted Mortality due to Suicide
7.7
Deaths per 100,000 population
(2019-2021)
Compared to:
MD Value
(9.7)
The regional value is compared to the Maryland State value.
US Value
(13.5 in 2020)
The regional value is compared to the national value. The source for the national value is Centers for Disease Control and Prevention
Prior Value
(7.8)
Prior Value compares a measured value with the previously measured value. Confidence intervals were not taken into account in determining the direction of the comparison.
Trend
This comparison measures the indicator’s values over multiple time periods.<br>The Mann-Kendall Test for Statistical Significance is used to evaluate the trend<br>over 4 to 10 periods of measure, subject to data availability and comparability.
Maryland SHIP 2017
(9.0)
<div><span>The Maryland SHIP 2017 Target is to decrease the suicide rate to 9.0 deaths per 100,000 population.</span></div>
Maryland SHIP 2014
(9.1)
<div>
<div><span>The Maryland SHIP 2014 Target is to decrease the suicide rate to 9.1 deaths per 100,000 population.</span></div>
</div>
HP 2030 Target
(12.8)
<div>MHMD-01: Reduce the suicide rate <strong>(LEADING HEALTH INDICATOR)</strong></div>
County: Montgomery Depression: Medicare Population
County: Montgomery Depression: Medicare Population
15.0%
(2022)
Compared to:
MD Counties
The distribution is based on data from 24 Maryland counties.
U.S. Counties
The distribution is based on data from 3,129 U.S. counties and county equivalents.
MD Value
(16.0%)
The regional value is compared to the Maryland State value.
US Value
(16.0%)
The regional value is compared to the national value.
Prior Value
(15.0%)
Prior Value compares a measured value with the previously measured value. Confidence intervals were not taken into account in determining the direction of the comparison.
Trend
This comparison measures the indicator’s values over multiple time periods.<br>The Mann-Kendall Test for Statistical Significance is used to evaluate the trend<br>over 4 to 10 periods of measure, subject to data availability and comparability.
County: Montgomery Households that Received Mental Healthcare Services
County: Montgomery Households that Received Mental Healthcare Services
9.0%
(2023)
Compared to:
MD Value
(8.9%)
The regional value is compared to the Maryland State value.
US Value
(8.8%)
The regional value is compared to the national value.
Prior Value
(8.2%)
Prior Value compares a measured value with the previously measured value. Confidence intervals were not taken into account in determining the direction of the comparison.
Trend
This comparison measures the indicator’s values over multiple time periods.<br>The Mann-Kendall Test for Statistical Significance is used to evaluate the trend<br>over 4 to 10 periods of measure, subject to data availability and comparability.
County: Montgomery Mental Health Provider Rate
County: Montgomery Mental Health Provider Rate
405
Providers per 100,000 population
(2023)
Compared to:
MD Counties
The distribution is based on data from 24 Maryland counties.
U.S. Counties
The distribution is based on data from 2,956 U.S. counties and county equivalents.
MD Value
(343)
The regional value is compared to the Maryland State value.
Prior Value
(378)
Prior Value compares a measured value with the previously measured value. Confidence intervals were not taken into account in determining the direction of the comparison.
Trend
This comparison measures the indicator’s values over multiple time periods.<br>The Mann-Kendall Test for Statistical Significance is used to evaluate the trend<br>over 4 to 10 periods of measure, subject to data availability and comparability.
County: Montgomery Poor Mental Health: 14+ Days
County: Montgomery Poor Mental Health: 14+ Days
12.5%
(2022)
Compared to:
MD Counties
The distribution is based on data from 24 Maryland counties.
U.S. Counties
The distribution is based on data from 3,133 U.S. counties and county equivalents.
US Value
(15.8%)
The regional value is compared to the national value.
County: Montgomery Poor Mental Health: Average Number of Days
County: Montgomery Poor Mental Health: Average Number of Days
4.4
Days
(2021)
Compared to:
MD Counties
The distribution is based on data from 24 Maryland counties.
U.S. Counties
The distribution is based on data from 3,141 U.S. counties and county equivalents.
MD Value
(4.4)
The regional value is compared to the Maryland State value.
US Value
(4.8)
The regional value is compared to the national value.
Prior Value
(4.0)
Prior Value compares a measured value with the previously measured value. Confidence intervals were taken into account in determining the direction of the comparison.
Trend
This comparison measures the indicator’s values over multiple time periods.<br>The Mann-Kendall Test for Statistical Significance is used to evaluate the trend<br>over 4 to 10 periods of measure, subject to data availability and comparability.
County: Montgomery
Health / Mortality Data
Value
Compared to:
County: Montgomery Premature Death
County: Montgomery Premature Death
4,629.1
Years per 100,000 population
(2019-2021)
Compared to:
MD Counties
The distribution is based on data from 24 Maryland counties.
U.S. Counties
The distribution is based on data from 2,886 U.S. counties and county equivalents.
MD Value
(7,921.4)
The regional value is compared to the Maryland State value.
US Value
(7,971.5)
The regional value is compared to the national value.
County: Montgomery
Health / Nutrition & Healthy Eating
Value
Compared to:
County: Montgomery Adults who Drank Soft Drinks: Past 7 Days
County: Montgomery Adults who Drank Soft Drinks: Past 7 Days
38.0%
(2023)
Compared to:
MD Counties
The distribution is based on data from 24 Maryland counties.
MD Value
(41.7%)
The regional value is compared to the Maryland State value.
US Value
(43.7%)
The regional value is compared to the national value.
County: Montgomery Adults who Frequently Cook Meals at Home
County: Montgomery Adults who Frequently Cook Meals at Home
83.4%
(2023)
Compared to:
MD Counties
The distribution is based on data from 24 Maryland counties.
MD Value
(79.8%)
The regional value is compared to the Maryland State value.
US Value
(78.0%)
The regional value is compared to the national value.
Prior Value
(80.4%)
Prior Value compares a measured value with the previously measured value. Confidence intervals were not taken into account in determining the direction of the comparison.
County: Montgomery Adults Who Frequently Used Quick Service Restaurants: Past 30 Days
County: Montgomery Adults Who Frequently Used Quick Service Restaurants: Past 30 Days
40.8%
(2023)
Compared to:
MD Counties
The distribution is based on data from 24 Maryland counties.
U.S. Counties
The distribution is based on data from 3,141 U.S. counties and county equivalents.
MD Value
(41.1%)
The regional value is compared to the Maryland State value.
US Value
(40.4%)
The regional value is compared to the national value.
Prior Value
(40.8%)
Prior Value compares a measured value with the previously measured value. Confidence intervals were not taken into account in determining the direction of the comparison.
Trend
This comparison measures the indicator’s values over multiple time periods.<br>The Mann-Kendall Test for Statistical Significance is used to evaluate the trend<br>over 4 to 10 periods of measure, subject to data availability and comparability.
County: Montgomery
Health / Older Adults
Value
Compared to:
County: Montgomery Adults 65+ who Received Recommended Preventive Services: Females
County: Montgomery Adults 65+ who Received Recommended Preventive Services: Females
47.8%
(2020)
Compared to:
MD Counties
The distribution is based on data from 24 Maryland counties.
U.S. Counties
The distribution is based on data from 3,141 U.S. counties and county equivalents.
US Value
(37.9%)
The regional value is compared to the national value.
County: Montgomery Adults 65+ who Received Recommended Preventive Services: Males
County: Montgomery Adults 65+ who Received Recommended Preventive Services: Males
53.7%
(2020)
Compared to:
MD Counties
The distribution is based on data from 24 Maryland counties.
U.S. Counties
The distribution is based on data from 3,141 U.S. counties and county equivalents.
US Value
(43.7%)
The regional value is compared to the national value.
County: Montgomery Adults 65+ with a Disability
County: Montgomery Adults 65+ with a Disability
26.5%
(2018-2022)
Compared to:
MD Value
(29.9%)
The regional value is compared to the Maryland State value.
US Value
(33.3%)
The regional value is compared to the national value.
Trend
This comparison measures the indicator’s values over multiple time periods.<br>The Mann-Kendall Test for Statistical Significance is used to evaluate the trend<br>over 4 to 10 periods of measure, subject to data availability and comparability.
County: Montgomery Adults 65+ with a Hearing Difficulty
County: Montgomery Adults 65+ with a Hearing Difficulty
10.4%
(2018-2022)
Compared to:
MD Value
(10.9%)
The regional value is compared to the Maryland State value.
US Value
(13.7%)
The regional value is compared to the national value.
Trend
This comparison measures the indicator’s values over multiple time periods.<br>The Mann-Kendall Test for Statistical Significance is used to evaluate the trend<br>over 4 to 10 periods of measure, subject to data availability and comparability.
County: Montgomery Adults 65+ with a Self-Care Difficulty
County: Montgomery Adults 65+ with a Self-Care Difficulty
6.7%
(2018-2022)
Compared to:
MD Value
(6.9%)
The regional value is compared to the Maryland State value.
US Value
(7.4%)
The regional value is compared to the national value.
Trend
This comparison measures the indicator’s values over multiple time periods.<br>The Mann-Kendall Test for Statistical Significance is used to evaluate the trend<br>over 4 to 10 periods of measure, subject to data availability and comparability.
County: Montgomery Adults 65+ with a Vision Difficulty
County: Montgomery Adults 65+ with a Vision Difficulty
4.5%
(2018-2022)
Compared to:
MD Value
(5.1%)
The regional value is compared to the Maryland State value.
US Value
(6.0%)
The regional value is compared to the national value.
Trend
This comparison measures the indicator’s values over multiple time periods.<br>The Mann-Kendall Test for Statistical Significance is used to evaluate the trend<br>over 4 to 10 periods of measure, subject to data availability and comparability.
County: Montgomery Adults 65+ with an Independent Living Difficulty
County: Montgomery Adults 65+ with an Independent Living Difficulty
12.7%
(2018-2022)
Compared to:
MD Value
(12.9%)
The regional value is compared to the Maryland State value.
US Value
(13.6%)
The regional value is compared to the national value.
Trend
This comparison measures the indicator’s values over multiple time periods.<br>The Mann-Kendall Test for Statistical Significance is used to evaluate the trend<br>over 4 to 10 periods of measure, subject to data availability and comparability.
County: Montgomery Age-Adjusted Death Rate due to Alzheimer's Disease
County: Montgomery Age-Adjusted Death Rate due to Alzheimer's Disease
11.4
Deaths per 100,000 population
(2018-2020)
Compared to:
MD Counties
The distribution is based on data from 22 Maryland counties.
U.S. Counties
The distribution is based on data from 2,140 U.S. counties and county equivalents.
MD Value
(15.1)
The regional value is compared to the Maryland State value.
US Value
(31.0)
The regional value is compared to the national value.
Prior Value
(12.3)
Prior Value compares a measured value with the previously measured value. Confidence intervals were taken into account in determining the direction of the comparison.
Trend
This comparison measures the indicator’s values over multiple time periods.<br>The Mann-Kendall Test for Statistical Significance is used to evaluate the trend<br>over 4 to 10 periods of measure, subject to data availability and comparability.
County: Montgomery Alzheimer's Disease or Dementia: Medicare Population
County: Montgomery Alzheimer's Disease or Dementia: Medicare Population
7.0%
(2022)
Compared to:
MD Counties
The distribution is based on data from 24 Maryland counties.
U.S. Counties
(2021)
The distribution is based on data from 3,129 U.S. counties and county equivalents.
MD Value
(7.0%)
The regional value is compared to the Maryland State value.
US Value
(6.0%)
The regional value is compared to the national value.
Prior Value
(7.0%)
Prior Value compares a measured value with the previously measured value. Confidence intervals were not taken into account in determining the direction of the comparison.
Trend
This comparison measures the indicator’s values over multiple time periods.<br>The Mann-Kendall Test for Statistical Significance is used to evaluate the trend<br>over 4 to 10 periods of measure, subject to data availability and comparability.
County: Montgomery
Health / Oral Health
Value
Compared to:
County: Montgomery Adults 65+ with Total Tooth Loss
County: Montgomery Adults 65+ with Total Tooth Loss
4.4%
(2022)
Compared to:
MD Counties
The distribution is based on data from 24 Maryland counties.
U.S. Counties
The distribution is based on data from 3,133 U.S. counties and county equivalents.
US Value
(12.2%)
The regional value is compared to the national value.
County: Montgomery Adults who Visited a Dentist
County: Montgomery Adults who Visited a Dentist
69.7%
(2022)
Compared to:
MD Counties
The distribution is based on data from 24 Maryland counties.
U.S. Counties
The distribution is based on data from 3,133 U.S. counties and county equivalents.
US Value
(63.9%)
The regional value is compared to the national value.
County: Montgomery Adults with No Tooth Extractions
County: Montgomery Adults with No Tooth Extractions
69.7%
(2020)
Compared to:
MD Counties
The distribution is based on data from 24 Maryland counties and county equivalents.
MD Value
(63.6%)
The regional value is compared to the Maryland State value.
US Value
(59.8%)
The regional value is compared to the national value. The source for the national value is Behavioral Risk Factor Surveillance System
Prior Value
(66.6%)
Prior Value compares a measured value with the previously measured value. Confidence intervals were taken into account in determining the direction of the comparison.
Trend
This comparison measures the indicator’s values over multiple time periods.<br>The Mann-Kendall Test for Statistical Significance is used to evaluate the trend<br>over 4 to 10 periods of measure, subject to data availability and comparability.
County: Montgomery Children who Visited a Dentist
County: Montgomery Children who Visited a Dentist
66.1%
(2021)
Compared to:
MD Counties
The distribution is based on data from 24 Maryland counties and county equivalents.
MD Value
(56.3%)
The regional value is compared to the Maryland State value.
Prior Value
(59.7%)
Prior Value compares a measured value with the previously measured value. Confidence intervals were not taken into account in determining the direction of the comparison.
Trend
This comparison measures the indicator’s values over multiple time periods.<br>The Mann-Kendall Test for Statistical Significance is used to evaluate the trend<br>over 4 to 10 periods of measure, subject to data availability and comparability.
Maryland SHIP 2017
(64.6%)
<div><span>The Maryland SHIP 2017 Target is to increase the proportion of individuals receiving dental care to 64.6%.</span></div>
Maryland SHIP 2014
(55.4%)
<div>
<div><span>The Maryland SHIP 2014 Target is to increase the proportion of individuals receiving dental care to 55.4%. </span></div>
</div>
County: Montgomery Dentist Rate
County: Montgomery Dentist Rate
127
Dentists per 100,000 population
(2022)
Compared to:
MD Counties
The distribution is based on data from 24 Maryland counties.
U.S. Counties
The distribution is based on data from 3,054 U.S. counties and county equivalents.
MD Value
(81)
The regional value is compared to the Maryland State value.
Prior Value
(126)
Prior Value compares a measured value with the previously measured value. Confidence intervals were not taken into account in determining the direction of the comparison.
Trend
This comparison measures the indicator’s values over multiple time periods.<br>The Mann-Kendall Test for Statistical Significance is used to evaluate the trend<br>over 4 to 10 periods of measure, subject to data availability and comparability.
County: Montgomery
Health / Other Conditions
Value
Compared to:
County: Montgomery Adults Who Visited a Dermatologist
County: Montgomery Adults Who Visited a Dermatologist
21.9%
(2023)
Compared to:
MD Value
(18.0%)
The regional value is compared to the Maryland State value.
US Value
(15.9%)
The regional value is compared to the national value.
Prior Value
(19.0%)
Prior Value compares a measured value with the previously measured value. Confidence intervals were not taken into account in determining the direction of the comparison.
Trend
This comparison measures the indicator’s values over multiple time periods.<br>The Mann-Kendall Test for Statistical Significance is used to evaluate the trend<br>over 4 to 10 periods of measure, subject to data availability and comparability.
County: Montgomery Adults with Arthritis
County: Montgomery Adults with Arthritis
20.8%
(2022)
Compared to:
MD Counties
The distribution is based on data from 24 Maryland counties.
U.S. Counties
The distribution is based on data from 3,133 U.S. counties and county equivalents.
US Value
(26.6%)
The regional value is compared to the national value.
County: Montgomery Adults with Kidney Disease
County: Montgomery Adults with Kidney Disease
2.9%
(2021)
Compared to:
MD Counties
The distribution is based on data from 24 Maryland counties.
U.S. Counties
The distribution is based on data from 3,074 U.S. counties and county equivalents.
US Value
(3.1%)
The regional value is compared to the national value.
County: Montgomery Age-Adjusted Death Rate due to Kidney Disease
County: Montgomery Age-Adjusted Death Rate due to Kidney Disease
7.2
Deaths per 100,000 population
(2018-2020)
Compared to:
MD Counties
The distribution is based on data from 21 Maryland counties.
U.S. Counties
The distribution is based on data from 1,416 U.S. counties and county equivalents.
MD Value
(10.6)
The regional value is compared to the Maryland State value.
US Value
(12.8)
The regional value is compared to the national value.
Prior Value
(8.3)
Prior Value compares a measured value with the previously measured value. Confidence intervals were taken into account in determining the direction of the comparison.
Trend
This comparison measures the indicator’s values over multiple time periods.<br>The Mann-Kendall Test for Statistical Significance is used to evaluate the trend<br>over 4 to 10 periods of measure, subject to data availability and comparability.
County: Montgomery Chronic Kidney Disease: Medicare Population
County: Montgomery Chronic Kidney Disease: Medicare Population
14.0%
(2022)
Compared to:
MD Counties
The distribution is based on data from 24 Maryland counties.
U.S. Counties
The distribution is based on data from 3,129 U.S. counties and county equivalents.
MD Value
(17.0%)
The regional value is compared to the Maryland State value.
US Value
(18.0%)
The regional value is compared to the national value.
Prior Value
(14.0%)
Prior Value compares a measured value with the previously measured value. Confidence intervals were not taken into account in determining the direction of the comparison.
Trend
This comparison measures the indicator’s values over multiple time periods.<br>The Mann-Kendall Test for Statistical Significance is used to evaluate the trend<br>over 4 to 10 periods of measure, subject to data availability and comparability.
County: Montgomery Osteoporosis: Medicare Population
County: Montgomery Osteoporosis: Medicare Population
14.0%
(2022)
Compared to:
MD Counties
The distribution is based on data from 24 Maryland counties.
U.S. Counties
The distribution is based on data from 3,129 U.S. counties and county equivalents.
MD Value
(11.0%)
The regional value is compared to the Maryland State value.
US Value
(11.0%)
The regional value is compared to the national value.
Prior Value
(13.0%)
Prior Value compares a measured value with the previously measured value. Confidence intervals were not taken into account in determining the direction of the comparison.
Trend
This comparison measures the indicator’s values over multiple time periods.<br>The Mann-Kendall Test for Statistical Significance is used to evaluate the trend<br>over 4 to 10 periods of measure, subject to data availability and comparability.
County: Montgomery Rheumatoid Arthritis or Osteoarthritis: Medicare Population
County: Montgomery Rheumatoid Arthritis or Osteoarthritis: Medicare Population
33.0%
(2022)
Compared to:
MD Counties
The distribution is based on data from 24 Maryland counties.
U.S. Counties
The distribution is based on data from 3,129 U.S. counties and county equivalents.
MD Value
(36.0%)
The regional value is compared to the Maryland State value.
US Value
(35.0%)
The regional value is compared to the national value.
Prior Value
(31.0%)
Prior Value compares a measured value with the previously measured value. Confidence intervals were not taken into account in determining the direction of the comparison.
Trend
This comparison measures the indicator’s values over multiple time periods.<br>The Mann-Kendall Test for Statistical Significance is used to evaluate the trend<br>over 4 to 10 periods of measure, subject to data availability and comparability.
County: Montgomery
Health / Physical Activity
Value
Compared to:
County: Montgomery Adults 20+ who are Sedentary
County: Montgomery Adults 20+ who are Sedentary
13.9%
(2021)
Compared to:
MD Counties
The distribution is based on data from 24 Maryland counties.
U.S. Counties
The distribution is based on data from 3,074 U.S. counties and county equivalents.
Prior Value
(14.6%)
Prior Value compares a measured value with the previously measured value. Confidence intervals were taken into account in determining the direction of the comparison.
Trend
This comparison measures the indicator’s values over multiple time periods.<br>The Mann-Kendall Test for Statistical Significance is used to evaluate the trend<br>over 4 to 10 periods of measure, subject to data availability and comparability.
County: Montgomery Adults Engaging in Regular Physical Activity
County: Montgomery Adults Engaging in Regular Physical Activity
51.1%
(2019)
Compared to:
MD Counties
The distribution is based on data from 24 Maryland counties and county equivalents.
MD Value
(51.8%)
The regional value is compared to the Maryland State value.
US Value
(23.2%)
The regional value is compared to the national value. The source for the national value is Behavioral Risk Factor Surveillance System
Prior Value
(53.5%)
Prior Value compares a measured value with the previously measured value. Confidence intervals were taken into account in determining the direction of the comparison.
Trend
This comparison measures the indicator’s values over multiple time periods.<br>The Mann-Kendall Test for Statistical Significance is used to evaluate the trend<br>over 4 to 10 periods of measure, subject to data availability and comparability.
HP 2030 Target
(29.7%)
<div>PA-05: Increase the proportion of adults who do enough aerobic and muscle-strengthening activity <strong>(LEADING HEALTH INDICATOR)</strong></div>
County: Montgomery Adults Who Belong to a Fitness Club or Gym
County: Montgomery Adults Who Belong to a Fitness Club or Gym
22.0%
(2023)
Compared to:
MD Value
(18.6%)
The regional value is compared to the Maryland State value.
US Value
(16.0%)
The regional value is compared to the national value.
Prior Value
(20.7%)
Prior Value compares a measured value with the previously measured value. Confidence intervals were not taken into account in determining the direction of the comparison.
County: Montgomery
Health / Prevention & Safety
Value
Compared to:
County: Montgomery Age-Adjusted Death Rate due to Falls
County: Montgomery Age-Adjusted Death Rate due to Falls
8.4
Deaths per 100,000 population
(2019-2021)
Compared to:
MD Value
(11.3)
The regional value is compared to the Maryland State value.
US Value
(10.3 in 2020)
The regional value is compared to the national value. The source for the national value is Centers for Disease Control and Prevention
Prior Value
(8.3)
Prior Value compares a measured value with the previously measured value. Confidence intervals were not taken into account in determining the direction of the comparison.
Trend
This comparison measures the indicator’s values over multiple time periods.<br>The Mann-Kendall Test for Statistical Significance is used to evaluate the trend<br>over 4 to 10 periods of measure, subject to data availability and comparability.
Maryland SHIP 2017
(7.7)
<div><span>The Maryland SHIP 2017 Target is to reduce the death rate related to falls to 7.7 deaths per 100,000 population.</span></div>
Maryland SHIP 2014
(7.1)
<div><span>The Maryland SHIP 2014 Target is to reduce the death rate related to falls to 7.1 deaths per 100,000 population.</span></div>
County: Montgomery Age-Adjusted Death Rate due to Unintentional Injuries
County: Montgomery Age-Adjusted Death Rate due to Unintentional Injuries
25.1
Deaths per 100,000 population
(2019-2021)
Compared to:
MD Value
(45.1)
The regional value is compared to the Maryland State value.
US Value
(57.6 in 2020)
The regional value is compared to the national value. The source for the national value is Centers for Disease Control and Prevention
Prior Value
(25.7)
Prior Value compares a measured value with the previously measured value. Confidence intervals were not taken into account in determining the direction of the comparison.
Trend
This comparison measures the indicator’s values over multiple time periods.<br>The Mann-Kendall Test for Statistical Significance is used to evaluate the trend<br>over 4 to 10 periods of measure, subject to data availability and comparability.
HP 2030 Target
(43.2)
County: Montgomery
Health / Respiratory Diseases
Value
Compared to:
County: Montgomery Adults Who Bought Medications for Asthma
County: Montgomery Adults Who Bought Medications for Asthma
6.1%
(2023)
Compared to:
MD Value
(6.5%)
The regional value is compared to the Maryland State value.
US Value
(6.6%)
The regional value is compared to the national value.
Prior Value
(6.1%)
Prior Value compares a measured value with the previously measured value. Confidence intervals were not taken into account in determining the direction of the comparison.
Trend
This comparison measures the indicator’s values over multiple time periods.<br>The Mann-Kendall Test for Statistical Significance is used to evaluate the trend<br>over 4 to 10 periods of measure, subject to data availability and comparability.
County: Montgomery Adults with Asthma
County: Montgomery Adults with Asthma
12.8%
(2021)
Compared to:
MD Counties
The distribution is based on data from 22 Maryland counties and county equivalents.
MD Value
(14.8%)
The regional value is compared to the Maryland State value.
US Value
(14.9%)
The regional value is compared to the national value. The source for the national value is Behavioral Risk Factor Surveillance System
Prior Value
(10.2%)
Prior Value compares a measured value with the previously measured value. Confidence intervals were taken into account in determining the direction of the comparison.
Trend
This comparison measures the indicator’s values over multiple time periods.<br>The Mann-Kendall Test for Statistical Significance is used to evaluate the trend<br>over 4 to 10 periods of measure, subject to data availability and comparability.
County: Montgomery Adults with COPD
County: Montgomery Adults with COPD
3.9%
Percent of adults
(2022)
Compared to:
MD Counties
The distribution is based on data from 24 Maryland counties.
U.S. Counties
The distribution is based on data from 3,133 U.S. counties and county equivalents.
US Value
(6.8%)
The regional value is compared to the national value.
County: Montgomery Age-Adjusted Death Rate due to Chronic Lower Respiratory Diseases
County: Montgomery Age-Adjusted Death Rate due to Chronic Lower Respiratory Diseases
12.8
Deaths per 100,000 population
(2019-2021)
Compared to:
MD Counties
(2018-2020)
The distribution is based on data from 20 Maryland counties and county equivalents.
MD Value
(23.8)
The regional value is compared to the Maryland State value.
US Value
(36.4 in 2020)
The regional value is compared to the national value. The source for the national value is Centers for Disease Control and Prevention
Prior Value
(13.6)
Prior Value compares a measured value with the previously measured value. Confidence intervals were not taken into account in determining the direction of the comparison.
Trend
This comparison measures the indicator’s values over multiple time periods.<br>The Mann-Kendall Test for Statistical Significance is used to evaluate the trend<br>over 4 to 10 periods of measure, subject to data availability and comparability.
County: Montgomery Asthma: Medicare Population
County: Montgomery Asthma: Medicare Population
6.0%
(2022)
Compared to:
MD Counties
The distribution is based on data from 24 Maryland counties.
U.S. Counties
The distribution is based on data from 3,129 U.S. counties and county equivalents.
MD Value
(7.0%)
The regional value is compared to the Maryland State value.
US Value
(7.0%)
The regional value is compared to the national value.
Prior Value
(6.0%)
Prior Value compares a measured value with the previously measured value. Confidence intervals were not taken into account in determining the direction of the comparison.
Trend
This comparison measures the indicator’s values over multiple time periods.<br>The Mann-Kendall Test for Statistical Significance is used to evaluate the trend<br>over 4 to 10 periods of measure, subject to data availability and comparability.
County: Montgomery COPD: Medicare Population
County: Montgomery COPD: Medicare Population
6.0%
(2022)
Compared to:
MD Counties
The distribution is based on data from 24 Maryland counties.
U.S. Counties
The distribution is based on data from 3,129 U.S. counties and county equivalents.
MD Value
(10.0%)
The regional value is compared to the Maryland State value.
US Value
(11.0%)
The regional value is compared to the national value.
Prior Value
(6.0%)
Prior Value compares a measured value with the previously measured value. Confidence intervals were not taken into account in determining the direction of the comparison.
Trend
This comparison measures the indicator’s values over multiple time periods.<br>The Mann-Kendall Test for Statistical Significance is used to evaluate the trend<br>over 4 to 10 periods of measure, subject to data availability and comparability.
County: Montgomery
Health / Sexually Transmitted Infections
Value
Compared to:
County: Montgomery Chlamydia Incidence Rate
County: Montgomery Chlamydia Incidence Rate
336.0
Cases per 100,000 population
(2022)
Compared to:
MD Counties
The distribution is based on data from 24 Maryland counties.
U.S. Counties
The distribution is based on data from 3,132 U.S. counties and county equivalents.
MD Value
(506.7)
The regional value is compared to the Maryland State value.
US Value
(495.0)
The regional value is compared to the national value.
Prior Value
(363.0)
Prior Value compares a measured value with the previously measured value. Confidence intervals were not taken into account in determining the direction of the comparison.
Trend
This comparison measures the indicator’s values over multiple time periods.<br>The Mann-Kendall Test for Statistical Significance is used to evaluate the trend<br>over 4 to 10 periods of measure, subject to data availability and comparability.
Maryland SHIP 2017
(431.0)
<div><span>The Maryland SHIP 2017 Target is to reduce the chlamydia incidence rate to 431.0 cases per 100,000 population.</span></div>
Maryland SHIP 2014
(431.0)
<div>
<div><span>The Maryland SHIP 2014 Target is to reduce the chlamydia incidence rate to 431.0 cases per 100,000 population.</span></div>
</div>
County: Montgomery Gonorrhea Incidence Rate
County: Montgomery Gonorrhea Incidence Rate
78.3
Cases per 100,000 population
(2022)
Compared to:
MD Counties
The distribution is based on data from 24 Maryland counties.
U.S. Counties
The distribution is based on data from 3,132 U.S. counties and county equivalents.
MD Value
(181.1)
The regional value is compared to the Maryland State value.
US Value
(194.4)
The regional value is compared to the national value.
Prior Value
(89.1)
Prior Value compares a measured value with the previously measured value. Confidence intervals were not taken into account in determining the direction of the comparison.
Trend
This comparison measures the indicator’s values over multiple time periods.<br>The Mann-Kendall Test for Statistical Significance is used to evaluate the trend<br>over 4 to 10 periods of measure, subject to data availability and comparability.
County: Montgomery HIV Diagnosis Rate
County: Montgomery HIV Diagnosis Rate
11.8
Cases per 100,000 population
(2022)
Compared to:
MD Value
(14.3)
The regional value is compared to the Maryland State value.
US Value
(13.3)
The regional value is compared to the national value.
Prior Value
(10.6)
Prior Value compares a measured value with the previously measured value. Confidence intervals were not taken into account in determining the direction of the comparison.
Trend
This comparison measures the indicator’s values over multiple time periods.<br>The Mann-Kendall Test for Statistical Significance is used to evaluate the trend<br>over 4 to 10 periods of measure, subject to data availability and comparability.
County: Montgomery HIV Prevalence Rate
County: Montgomery HIV Prevalence Rate
445.2
Cases per 100,000 population
(2021)
Compared to:
MD Value
(643.4)
The regional value is compared to the Maryland State value.
US Value
(382.2)
The regional value is compared to the national value.
Prior Value
(439.3)
Prior Value compares a measured value with the previously measured value. Confidence intervals were not taken into account in determining the direction of the comparison.
Trend
This comparison measures the indicator’s values over multiple time periods.<br>The Mann-Kendall Test for Statistical Significance is used to evaluate the trend<br>over 4 to 10 periods of measure, subject to data availability and comparability.
County: Montgomery HIV Prevalence Rate
County: Montgomery HIV Prevalence Rate
455.2
Cases per 100,000 population
(2022)
Compared to:
MD Value
(643.8)
The regional value is compared to the Maryland State value.
US Value
(386.6)
The regional value is compared to the national value.
Prior Value
(445.2)
Prior Value compares a measured value with the previously measured value. Confidence intervals were not taken into account in determining the direction of the comparison.
Trend
This comparison measures the indicator’s values over multiple time periods.<br>The Mann-Kendall Test for Statistical Significance is used to evaluate the trend<br>over 4 to 10 periods of measure, subject to data availability and comparability.
County: Montgomery Syphilis Incidence Rate
County: Montgomery Syphilis Incidence Rate
8.6
Cases per 100,000 population
(2022)
Compared to:
MD Counties
The distribution is based on data from 24 Maryland counties.
MD Value
(12.7)
The regional value is compared to the Maryland State value.
US Value
(17.7)
The regional value is compared to the national value.
Prior Value
(7.2)
Prior Value compares a measured value with the previously measured value. Confidence intervals were not taken into account in determining the direction of the comparison.
Trend
This comparison measures the indicator’s values over multiple time periods.<br>The Mann-Kendall Test for Statistical Significance is used to evaluate the trend<br>over 4 to 10 periods of measure, subject to data availability and comparability.
County: Montgomery
Health / Tobacco Use
Value
Compared to:
County: Montgomery Adolescents who Use Tobacco
County: Montgomery Adolescents who Use Tobacco
11.7%
(2021)
Compared to:
MD Counties
The distribution is based on data from 24 Maryland counties and county equivalents.
MD Value
(15.6%)
The regional value is compared to the Maryland State value.
Prior Value
(22.2%)
Prior Value compares a measured value with the previously measured value. Confidence intervals were not taken into account in determining the direction of the comparison.
Trend
This comparison measures the indicator’s values over multiple time periods.<br>The Mann-Kendall Test for Statistical Significance is used to evaluate the trend<br>over 4 to 10 periods of measure, subject to data availability and comparability.
Maryland SHIP 2017
(15.2%)
<div><span>The Maryland SHIP 2017 Target is to reduce the proportion of adolescents who use any kind of tobacco product to 15.2%.</span></div>
Maryland SHIP 2014
(22.3%)
<div>
<div><span>The Maryland SHIP 2014 Target is to reduce the proportion of adolescents who use any kind of tobacco product to 22.3%. </span></div>
</div>
County: Montgomery Adults Who Bought Medications to Quit Smoking
County: Montgomery Adults Who Bought Medications to Quit Smoking
1.1%
(2023)
Compared to:
MD Value
(1.2%)
The regional value is compared to the Maryland State value.
US Value
(1.4%)
The regional value is compared to the national value.
Prior Value
(1.1%)
Prior Value compares a measured value with the previously measured value. Confidence intervals were not taken into account in determining the direction of the comparison.
Trend
This comparison measures the indicator’s values over multiple time periods.<br>The Mann-Kendall Test for Statistical Significance is used to evaluate the trend<br>over 4 to 10 periods of measure, subject to data availability and comparability.
